How Accurate Is TikTok Shop Data and How Often Does It Update?

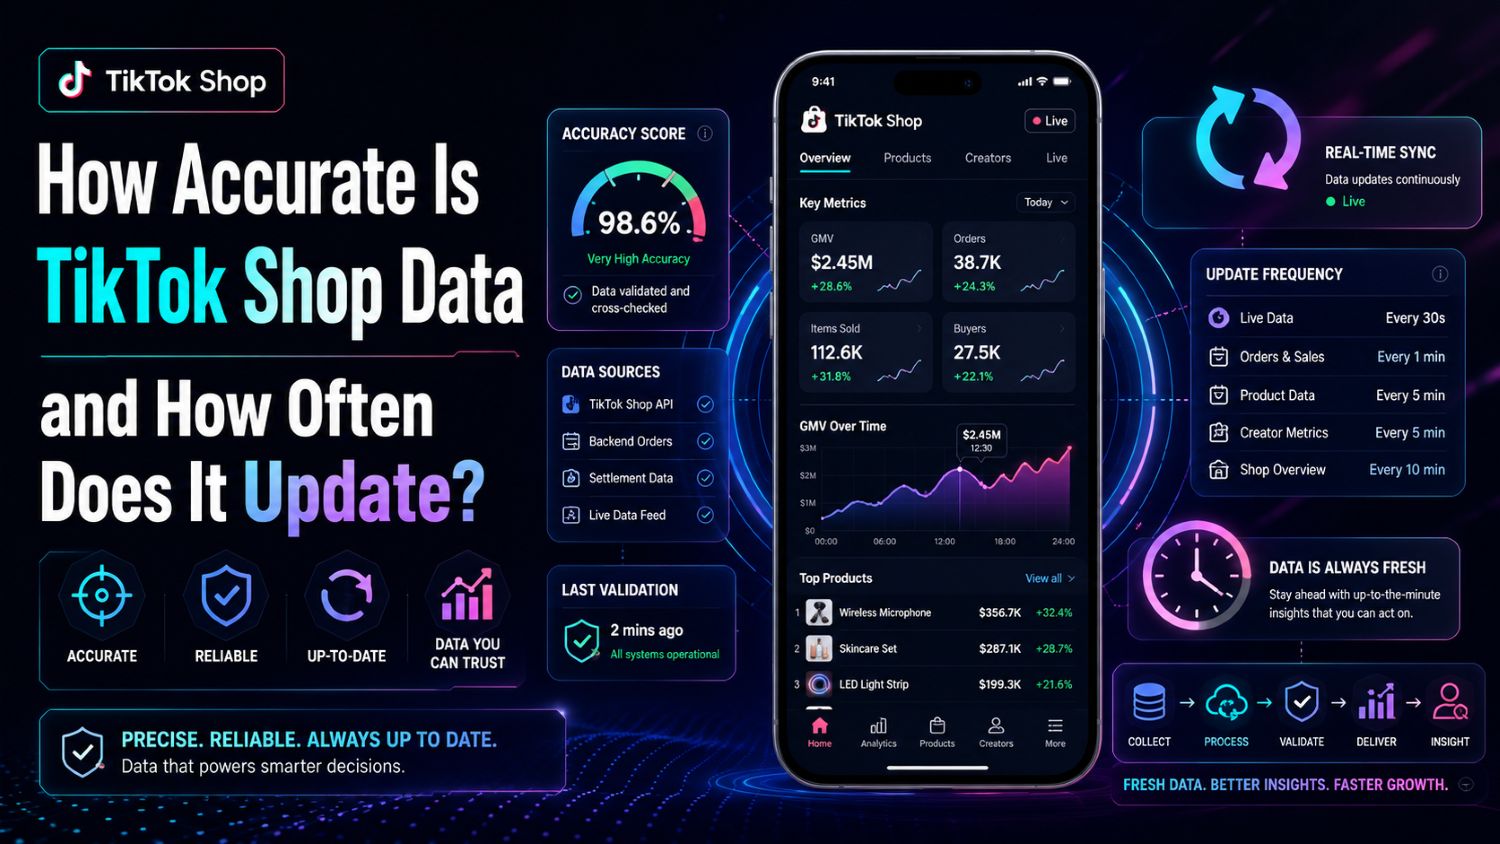
TikTok Shop data does not update at one fixed speed.
Product details, video views, creator sales and LIVE results can refresh at different times. Some numbers come directly from an authorized seller account. Others are collected from public market activity or calculated as estimates.
That difference matters.
Estimated GMV is useful for comparing products. It should not be treated as a seller’s final settled revenue.
For a complete explanation of product, shop, creator, video and sales metrics, read our TikTok Shop data guide.
This article explains how TikTok Shop sales data update frequency works, why numbers change and how to decide whether the data is reliable enough for your next move.
Quick Answer: How Often Does TikTok Shop Data Update?
There is no single update schedule for all TikTok Shop data.
Product listings and video engagement may update quickly. Sales estimates, creator attribution and completed LIVE totals may take longer to process.
The update speed also depends on the source.
First-party order data from your own authorized shop is usually more direct. Competitor sales data is often estimated from available market signals, so it may update on a different schedule.
Before using a number, check four things:
When the data was collected
Which country it covers
Whether it is confirmed or estimated
Which sales status the metric includes
Do not assume that every number shown in an analytics tool is final settlement data.
What Types of TikTok Shop Data Are Available?
TikTok Shop data covers more than product sales.
Sellers can use it to study listings, shops, creators, videos and LIVE rooms. Each data type has different uses and limitations.
Product Data
Product data can include:
Product title
Category
Price
Product images
Shop name
Rating and reviews
Units sold
Estimated sales
Estimated GMV
Ranking movement
Basic product details are usually easier to collect than complete financial results.
A product’s title or price can be visible at the time of collection. Its sales total may change later because of new orders, cancellations or returns.
For product research, focus on direction as well as size.
A product growing steadily for three weeks is often more useful than a product that produced one large daily spike.
Shop and Sales Data
Shop data may include:
Product count
Estimated sales
Estimated GMV
Top products
Category distribution
Creator activity
Recent ranking movement
Data from your own connected seller account can include confirmed order information within the access you authorize.
Competitor shop data is different.
A third-party platform normally cannot see every competitor’s private orders, refunds, fees and payouts. Competitor revenue figures are therefore often estimates.
Use them to compare shops. Do not use them as audited financial statements.
Creator and Affiliate Data
Creator data helps sellers decide who may be worth contacting.
Useful fields can include:
Follower count
Recent video performance
Products promoted
Posting frequency
Estimated product sales
Estimated GMV
LIVE performance
Previous brand or shop relationships
Creator attribution can change after the first data collection.
An order may be attributed after a delay. It may also be cancelled or refunded later.
This is why creator sales should be checked over a wider period instead of one day.
Video Data
Video data may include:
Views
Likes
Comments
Shares
Publish date
Linked product
Estimated product sales
Estimated GMV
Engagement continues to grow after publication.
A video with 20,000 views today may have 50,000 views next week. This does not mean the earlier number was wrong. It was a snapshot from an earlier time.
Always check the collection time before comparing two videos.
LIVE Shopping Data
LIVE data can include:
Stream duration
Audience size
Peak viewers
Products promoted
Items sold
Orders
Estimated GMV
Audience movement
LIVE data can change during and after a session.
A running stream shows an incomplete result. Totals may also be adjusted after the session when orders, attribution or cancellations are processed.
Use LIVE monitoring to understand performance as it happens. Use the completed session result for final comparison.
First-Party vs Third-Party TikTok Shop Data
First-party and third-party data answer different questions.
First-party data comes from an account you own or are authorized to access. It is the right source for confirmed orders, refunds, inventory, revenue and payouts.
Third-party data helps you study the wider market.
It can show which products are gaining traction, which shops are growing and which creators are actively selling. Some commercial metrics may be estimated because private competitor transactions are not publicly available.
Data source | Best use | Main limitation |
|---|---|---|
First-party seller data | Store operations and financial reporting | Limited to authorized accounts |
Public market data | Product, content and competitor monitoring | May not show private transaction details |
Third-party estimates | Comparing products, shops and creators | May not equal final settled revenue |
One source does not replace the other.
Use first-party data to manage your business. Use third-party data to understand the market around it.
How Accurate Are TikTok Shop Sales Estimates?
TikTok Shop sales estimates can be useful without being exact.
Their value is in comparison.
For example, estimated data can help you see:
Which product is growing faster
Which shop dominates a category
Whether demand is rising or falling
Which creators may be generating sales
Whether performance comes from videos or LIVE
Whether several creators are promoting the same product
Accuracy depends on the available signals, collection time, market coverage and calculation method.
A good estimate should stay reasonably consistent with market movement. It does not need to match a shop’s final payout down to the last dollar to support product research.
Problems begin when sellers treat estimated GMV as profit.
GMV does not account for every cost. It may not reflect refunds, platform fees, creator commission, advertising costs, fulfillment or product cost.
Use estimates to find opportunities. Use your own account and financial records to calculate profit.
Why TikTok Shop Numbers Differ Across Platforms
Two analytics platforms may show different numbers for the same product.
That does not automatically mean one platform is wrong.
The difference may come from timing, coverage or methodology.
Different Update Times
One platform may have collected the product this morning. Another may have collected it last night.
A fast-selling product can move significantly between those two timestamps.
Check when the figure was last updated before comparing it.
Different Market Coverage
TikTok Shop operates across multiple countries.
A platform may cover the US market well but have less complete coverage in a newer region. Another platform may track more products in Southeast Asia.
Make sure both tools are showing the same country.
Products with similar names may have separate listings, prices and sales performance in different markets.
Returns and Cancelled Orders
A visible sales total may change after an order is cancelled or returned.
Some metrics may reflect orders placed. Others may reflect completed orders or items sold.
These are not the same measurement.
If a platform does not explain the metric, avoid using it for precise financial analysis.
Currency and Time-Zone Differences
Platforms may convert currencies using different exchange rates or collection times.
They may also group daily performance using different time zones.
A sale near midnight could be included in Tuesday’s data on one platform and Wednesday’s data on another.
Use the same currency, country and reporting period when comparing results.
Estimated vs Confirmed Revenue
Confirmed revenue comes from an authorized account or financial record.
Estimated revenue is calculated from observable market data.
A platform may show estimated GMV for competitors while your Seller Center shows confirmed revenue for your own store. These numbers should not be compared as if they came from the same source.
Missing or Delayed Public Data
Public data may sometimes appear late or be temporarily unavailable.
A listing could change status. A shop could remove a product. Creator attribution might not be visible immediately.
Platforms may handle these gaps differently.
One may keep the latest available value. Another may wait until it can collect a new result.
Understanding the limitations of TikTok Shop data is essential before comparing products, shops or creators.
TikTok Shop Data Update Frequency by Metric
The exact TikTok Shop sales data update frequency depends on the metric, source and platform.
The table below gives a practical way to interpret common data types. It does not promise a fixed refresh interval.
Metric | Typical Use | Possible Delay | Accuracy Consideration |
|---|---|---|---|
Product sales | Product research | Varies | Returns may change totals |
Estimated GMV | Market comparison | Varies | May not equal settled revenue |
Creator sales | Creator evaluation | Varies | Attribution may change |
Video performance | Content research | Usually faster | Engagement continues growing |
LIVE sales | LIVE monitoring | Varies | Session totals may be revised |
Product descriptions and prices can also change. A current listing snapshot does not always explain what was displayed during an earlier sales period.
Historical records become important here.
They let you see when the price changed, when sales accelerated and whether a ranking movement lasted more than a few days.
How to Check Whether TikTok Shop Data Is Reliable
You do not need perfect data to make a useful decision.
You need data that is recent, clearly defined and consistent enough for the question you are asking.
Check the Data Timestamp
Always start with the collection time.
A sales estimate collected today is more useful for current product research than one collected two weeks ago.
Older data still has value when it is clearly presented as historical information.
The problem is not old data. The problem is old data presented as current.
Confirm the Country and Market
Check that the product, shop and creator data belong to your target market.
A successful beauty product in Indonesia may not perform the same way in the United Kingdom.
Pricing, regulations, consumer behavior and creator ecosystems differ by country.
Do not combine several markets into one product decision unless that is your intended strategy.
Compare Trends Instead of One Number
One figure can be misleading.
A product with high GMV may already be slowing down. A smaller product may be growing every week.
Look at:
Sales movement
Ranking history
Number of active creators
Video publishing frequency
LIVE activity
Shop growth
Price changes
Several signals moving together create a stronger case.
Review Historical Consistency
TikTok Shop historical data shows whether performance is stable.
Look for sudden gaps, unexplained jumps or changes that affect many products at the same time.
A market-wide jump may come from a reporting or methodology change rather than a sudden increase in consumer demand.
Historical data also helps you find products before they become saturated.
Validate Important Decisions with First-Party Data
Third-party data is useful for discovery.
Before making a large inventory or advertising commitment, run your own test.
Use your first-party results to check:
Conversion rate
Refund rate
Product margin
Creator commission
Advertising cost
Shipping cost
Customer feedback
Market data can tell you where to look. Your own sales data tells you whether the opportunity works for your business.
How Sellers Should Use Estimated TikTok Shop Data
Estimated TikTok Shop sales should help you reduce uncertainty.
They should not replace judgment.
A practical product research workflow looks like this:
Find products with recent sales growth.
Check whether growth has continued for several days or weeks.
Review the number of creators promoting each product.
Identify the videos and LIVE rooms linked to that growth.
Compare the leading shops and their prices.
Check whether demand depends on one viral creator.
Test the product with a controlled budget.
Use first-party results before scaling.
Pay close attention to concentration.
A product supported by 20 active creators may be more repeatable than a product whose sales came from one viral video.
The highest-GMV product is not always the best product to test.
Sometimes the better opportunity is a smaller product with steady growth, several active creators and manageable competition.
How EchoTik Presents TikTok Shop Market Data
EchoTik brings product, shop, creator, video and LIVE research into one workflow.
Instead of judging an opportunity from one estimated number, sellers can compare several market signals.
These can include:
Product sales and estimated GMV
Product ranking movement
Shop performance
Creator activity
Video engagement
LIVE performance
Category results
Historical trends
This makes the data more useful.
If estimated GMV is rising, you can check whether creator activity and video performance are also rising. If those signals support each other, the opportunity is stronger.
When reviewing data in EchoTik, check the market, reporting period and displayed timestamp.
Treat estimates as research signals. Use confirmed data from your own TikTok Shop account for accounting and final profit calculations.
Sellers can start with EchoTik E-commerce Analysis to compare products, shops and creators.
For active stream research, use EchoTik Live Monitor to study LIVE rooms and performance trends.
Practical Takeaways
TikTok Shop data can be accurate enough for research without being final financial data.
The key is knowing what you are looking at.
Remember:
Different metrics update at different times.
Competitor sales and GMV may be estimated.
Returns and cancellations can change totals.
Currency, market and time zone affect comparisons.
Historical movement is more useful than one isolated number.
Important decisions should be validated with first-party data.
Do not ask whether every estimate is exact.
Ask whether the data is recent, transparent and consistent enough to help you make a better decision.
Frequently Asked Questions
Is TikTok Shop sales data real time?
Not all TikTok Shop sales data is real time.
Some authorized order events can update quickly. Competitor sales estimates, creator attribution and completed LIVE totals may update on a different schedule.
Check the timestamp and reporting period before using the data.
Are third-party TikTok Shop sales estimates accurate?
They can be useful for comparing products, shops and creators.
However, they may not match a seller’s final revenue because private transactions, refunds, commissions and other adjustments are not always available.
Use estimates for market research, not accounting.
Why do sales numbers change later?
Sales numbers may change because of new orders, delayed attribution, cancellations, refunds or a later data refresh.
The displayed value may also represent a different order status from the one you expected.
Check the metric definition before comparing results.
Does TikTok Shop data include refunds?
It depends on the source and metric.
Some sales counts may include orders that are later returned. Other reports may adjust totals after refunds are processed.
Do not assume estimated GMV equals settled revenue after refunds.
Can I download historical TikTok Shop data?
This depends on the platform, market and subscription level.
Some analytics platforms provide historical reports or exports for products, shops, creators and LIVE performance.
Before choosing a tool, check the available date range, export fields and supported markets.
Make Better Decisions with EchoTik Data
Use EchoTik to compare product momentum, shop performance, creator activity, videos and LIVE results before testing your next product.