How to Compare TikTok Shop Markets Using Sales and Creator Data

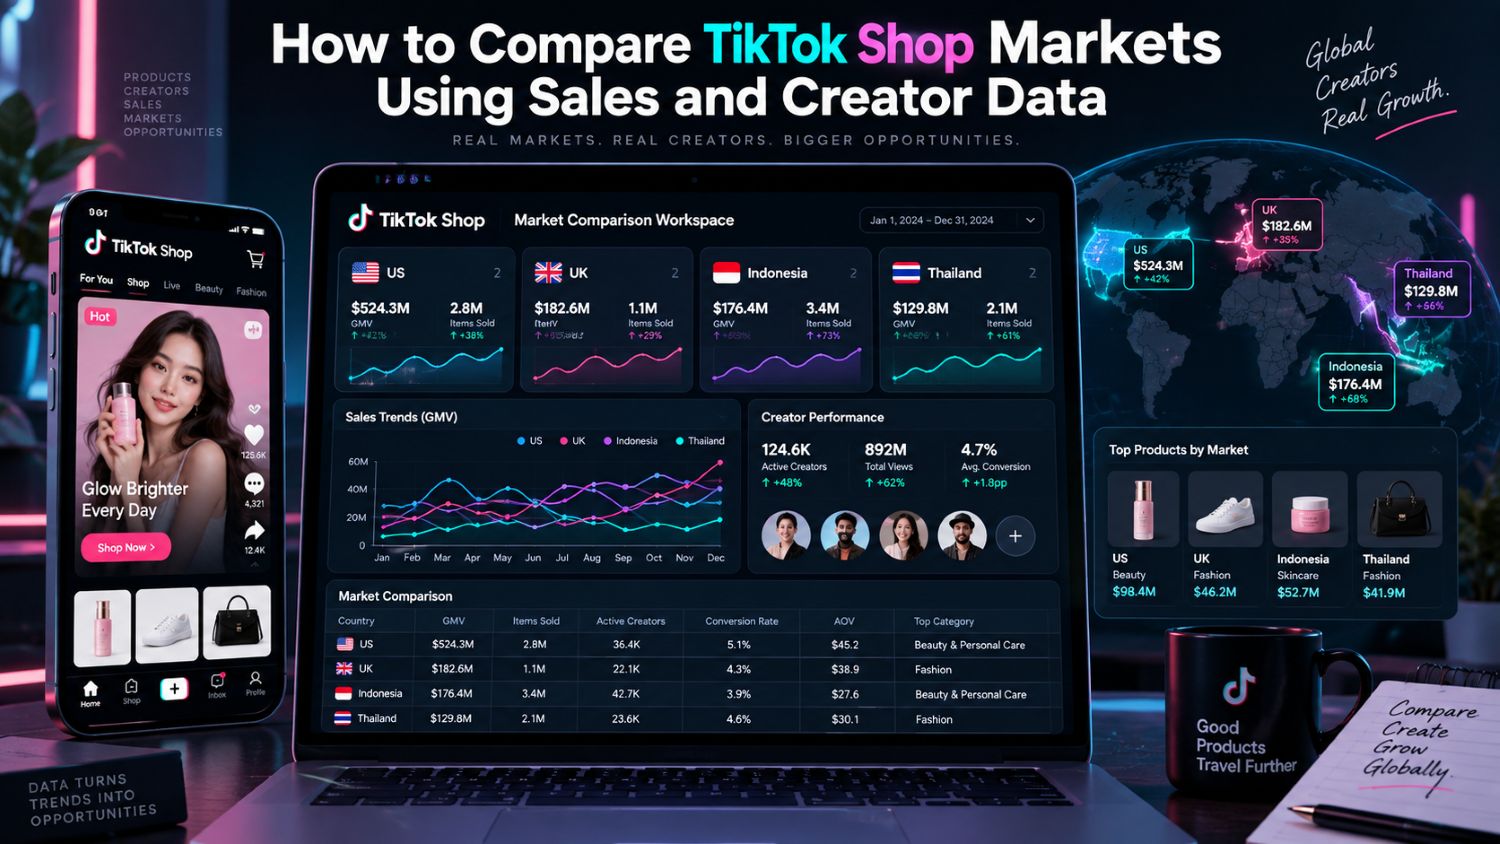
A product can look like a winner in one TikTok Shop market and barely move in another.
That does not always mean the product is bad. The price may be wrong for that country. Creators may sell the category differently. The market may already be crowded with similar listings. Or the numbers may not be using the same date range or sales definition.
Before deciding where to launch next, compare the markets in a way that makes the numbers useful.
Start with one product category
Trying to compare every category in two countries at once usually creates noise.
Pick a product type you are actually considering. It could be hair tools, kitchen organizers, collagen supplements, phone accessories, or pet products. Then look at the same category in each market over the same period.
You want to see whether there is real demand, not just one product having a viral week.
A market with ten strong sellers may still be worth entering. But if all ten are selling nearly identical products at prices you cannot match, the opportunity may be smaller than the sales total suggests.
The first comparison should be simple:
Which products are selling repeatedly?
What price do customers appear to pay?
How many shops are actively competing?
Is sales volume spread across several listings or dominated by one brand?
That last point matters. A category led by one major brand can look large from the outside, while newer sellers may have very little room to compete.
Sales numbers only work when the date range matches
It is easy to compare a 30-day result in one country with a seven-day result in another without noticing. The chart still looks clean. The conclusion is wrong.
Use the same time period for every market. If you are reviewing the last 30 days in the United States, use the last 30 days in the United Kingdom, Indonesia, or Mexico too.
Then look at what happened during that period.
Was there a major shopping event? A holiday? A large creator campaign? A platform-funded promotion? A new product launch can create a spike that does not reflect normal demand.
For example, a beauty product may show strong GMV in one market because it was bundled with a limited-time coupon. Another market may have lower GMV but better full-price sales. The second market could be healthier for a seller who does not want to rely on deep discounts.
Do not compare list prices alone either. A product listed at $15 may regularly sell for $10 after discounts. If another country sells the same product at a steady $12 with fewer promotions, that difference changes the margin story.
Price tells you more than demand
A category can have strong sales and still be hard to enter.
Say portable blenders are moving well in two markets. In Market A, most successful listings sell around $19 to $24. In Market B, similar products appear closer to $11 to $15, often with free shipping and creator coupons.
The raw sales volume may be higher in Market B. But if your landed cost is $8 before commission and fulfillment, Market A may give you more room to build a real business.
Look for the price customers are actually paying, not just the lowest visible SKU price. Some listings use a cheap accessory or partial variant to make the product card look more affordable. Others lean heavily on bundles.
You also need to keep currency in perspective. Convert prices using one exchange-rate snapshot for the analysis, then note that local taxes, shipping costs, purchasing power, and platform promotions can still make the same dollar figure mean very different things.
A $20 beauty product is not automatically positioned the same way in every market.
Count the shops, then look at how they are selling
A crowded market is not always a bad market. It can mean people are already comfortable buying that category through TikTok Shop.
The better question is whether new sellers have a clear way in.
Look at the shops near the top of the category. Are they mostly official brands with established audiences? Are they reseller stores competing on price? Are there newer shops getting traction through short videos and affiliates?
You may find that one country is dominated by a few large shops, while another has dozens of smaller sellers sharing demand. The second market may be easier to test even if the headline GMV is lower.
Watch how much concentration exists at the top.
If the first three shops account for nearly all visible sales, a new seller needs a sharp angle: better product quality, stronger creator content, faster delivery, a bundle that makes sense, or a more specific customer segment.
If sales are spread across many shops, the category may be more open—but it can also mean shoppers are highly price-sensitive. Read the listings and watch the content before making the call.
Creator activity shows how buyers are being convinced
A product can sell through polished brand videos in one country and through casual affiliate demos in another.
That difference matters because it changes your launch plan.
If a category is driven by creators, look at what they are actually doing. Are they posting quick problem-solution videos? Are they going LIVE to answer questions? Are they leading with price, before-and-after results, or product comparisons?
A skincare product may need a creator who explains texture, ingredients, and routine placement. A household gadget might only need a quick demo showing a real annoyance being solved.
You can also learn from the amount of creator activity.
A market with many active creators may offer more partnership opportunities, but it may also be expensive if every seller is competing for the same people. A market with fewer creators can be less crowded, though you may need to spend more time finding the right fit and giving them a clear product angle.
For wider research, our 7 best data analytics tools article covers general options for working with larger datasets and exports. It is not a market-entry checklist, but it can help when you need to organize more than a few country comparisons.
Keep estimates and owned data separate
Your own Seller Center reports are the closest thing to confirmed sales data for your shop.
Market data, competitor estimates, and public creator activity are still useful. They help you decide where to investigate. They should not be treated as another seller’s audited revenue.
Keep the labels clear in your notes:
Your shop’s actual orders and settlement data
Estimated competitor sales
Public creator signals, such as videos and engagement
Product price observations
Promotion periods and known campaign activity
That little bit of discipline prevents a lot of bad decisions. A competitor may look unbeatable because their estimated GMV is high, but the estimate may include a short campaign window, refunded orders, or sales tied to a one-time creator push.
The goal is not to find a country with zero competition. It is to find a market where customer demand, pricing, product fit, and creator activity line up well enough for you to test without guessing.
When you are ready to compare current products, shops, creators, and sales patterns across markets, use the EchoTik data dashboard as your starting point.