How to Export TikTok Shop Data: Orders, Sales and Reports

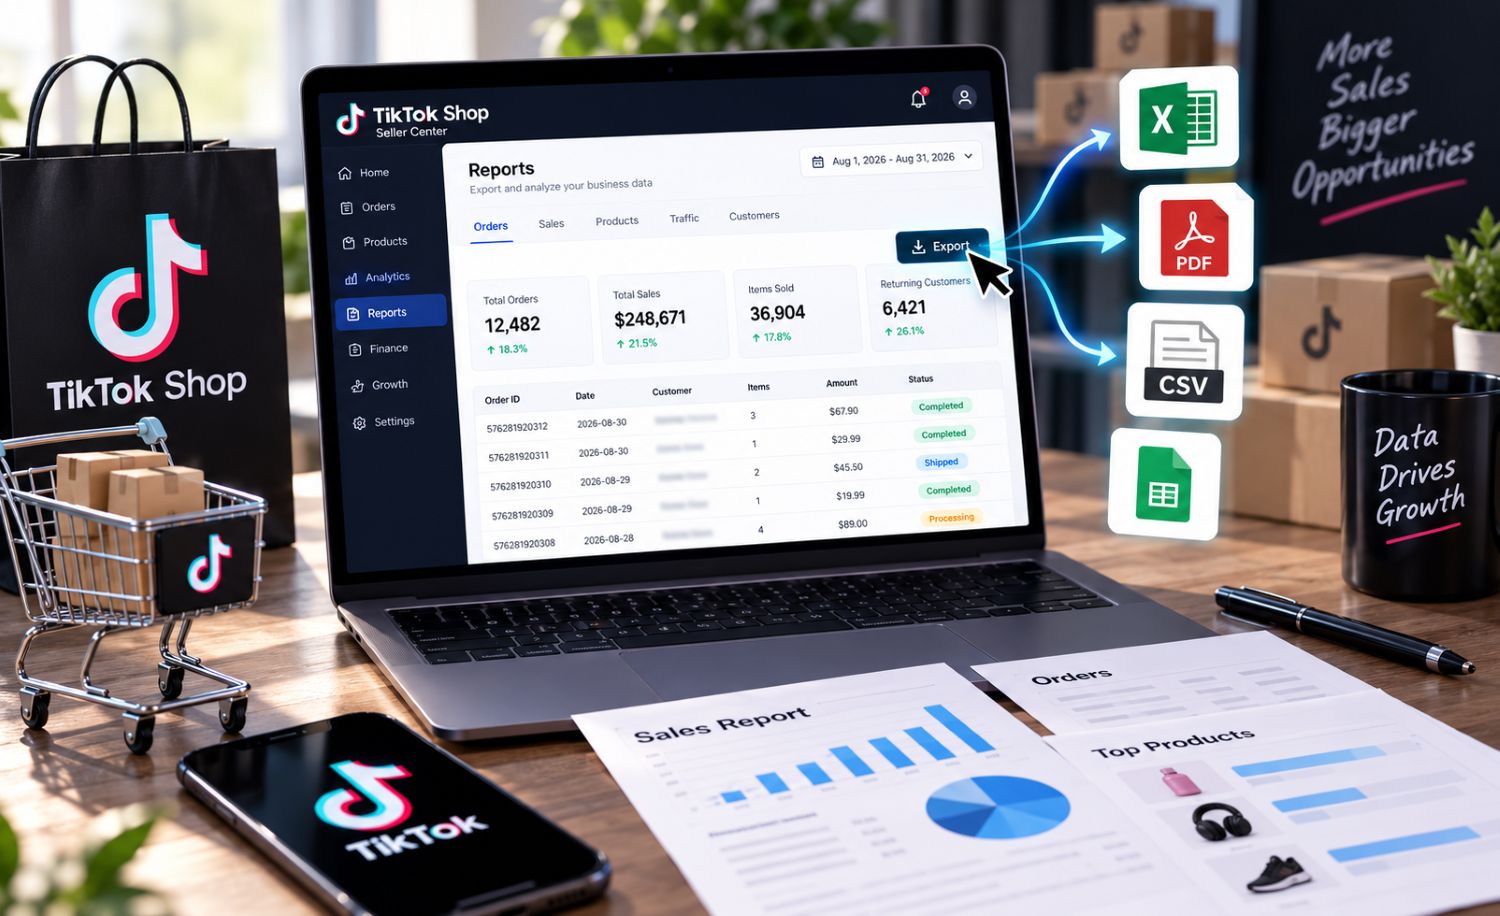
How to Export TikTok Shop Data
Exporting TikTok Shop data sounds simple until you open the file.
You expect a clean sales report. Instead, you get dozens of columns, order IDs turned into scientific notation, product names written three different ways, and totals that do not match the number on your dashboard.
That is normal. TikTok Shop exports are useful, but they are rarely ready to use straight out of the box.
Once you know which report to pull and what each column is actually telling you, the mess becomes manageable. You can spot weak products, costly creators, refund problems, and sales that look great on the surface but are not making much money.
What TikTok Shop Data Can You Export?
Most sellers do not need every report in Seller Center.
The files worth pulling regularly are orders, product sales, affiliate performance, refunds, and settlement data. Together, they show the full picture: what sold, who drove the sale, what was returned, and what money reached your account.
The key is knowing what question you are trying to answer before you hit Export.
Need to ship orders? Pull the order report. Trying to decide whether to restock a SKU? Look at product sales and refunds. Wondering whether a creator is worth another round of samples? Check attributed orders, commission, and refund quality.
How to Export Orders From TikTok Seller Center
Your order export is the file you will probably use the most.
In Seller Center, open Manage Orders, select the order status and date range you want, then look for Export. Depending on the market and your account setup, the button may sit in a slightly different place, but the workflow is usually the same.
For a weekly sales review, use paid or completed orders. For fulfillment, export unshipped orders. Keep canceled and refunded orders separate. Mixing them all together makes the report harder to read later.
TikTok Shop’s U.S. guidance directs sellers to Orders > Manage Orders > Export for the Orders Report. That report can include order-level details like item subtotal, seller-funded discounts, shipping fees, and paid time. TikTok Shop’s order-report guidance is worth checking if you need to reconcile order totals.
One small but important habit: save the untouched download somewhere safe before you start filtering or editing it. At some point, you will need to go back and check the raw numbers.
How to Download Product and Sales Reports
Order reports tell you what customers purchased. Product reports tell you whether a product actually deserves more attention.
Pull the report at product or SKU level, then sort it by sales, units sold, or GMV. You will usually see a few products doing most of the heavy lifting.
That is where things get interesting.
A product can have huge impressions and barely any clicks. Usually, the problem is not the product itself. It may be the thumbnail, first frame of the video, price point, title, or the audience seeing it.
On the other hand, a product may get plenty of clicks and product-page visits but still struggle to close sales. That usually points to the listing: weak reviews, unclear variants, poor shipping expectations, or a price that does not hold up against similar products.
TikTok Shop also allows sellers to export filtered performance data for shoppable videos. That makes it easier to see which videos are actually driving GMV, rather than just collecting views. TikTok’s shoppable-video reporting guide covers the current export process.
How to Export Affiliate and Creator Performance
Creator reporting can be a goldmine, but only if you look beyond reach.
A creator with a viral video may bring a lot of traffic without bringing many buyers. Another creator might deliver fewer views but generate consistent orders from people who are ready to purchase. That second creator is often more valuable.
Export creator or affiliate performance from the relevant Seller Center section, then review it by creator, product, campaign, or date range.
The fields that matter most are usually:
Creator name or ID
Product promoted
Attributed orders
Attributed GMV
Commission paid
Refunds or canceled orders
Video or LIVE source
The most painful creator mistake is sending more samples because a video “looked big.” Look at the orders. Look at the commission. Then check whether those orders stayed completed or came back as refunds.
If you are reviewing creator-side earnings data, remember that commission GMV and shop-level GMV may not match exactly. They can be based on different order sets and timing rules. TikTok’s earnings analytics guide explains why those numbers can differ.
How to Export Refund and Cancellation Data
Refund data is where many sellers find the issue they have been missing.
A product might look like a winner in your sales report. Then you pull returns and discover that buyers keep complaining about size, quality, packaging, or delivery.
That changes the story fast.
Export refund and cancellation data weekly, then sort it by SKU and reason. You are not looking for one-off complaints. You are looking for repeated signals.
For example, a sudden jump in cancellations can point to stock problems, slow shipping, or a misleading offer. A high refund rate after delivery usually points back to the product, the listing, or a creator video that overpromised.
Gross sales get attention. Net sales pay the bills.
Understanding the Columns in a TikTok Shop CSV
TikTok Shop CSV files can be a headache the first time you open them.
One report may use order-level rows. Another may use SKU-level rows. Finance files can use settlement dates, while sales reports may use paid dates. If you add everything together without checking the structure first, you can end up double-counting sales.
Here are the fields you will see most often:
Column | What it usually means |
|---|---|
Order ID | The customer transaction reference |
SKU ID | The exact product variant sold |
Paid time | When the buyer completed payment |
Settlement time | When the order reached settlement |
Quantity | Number of units sold |
GMV | Gross merchandise value before later adjustments |
Seller discount | Discount paid for by your shop |
Platform discount | Discount covered by TikTok or a campaign |
Affiliate commission | Creator or affiliate cost |
Refund amount | Money returned to the customer |
Order status | Paid, shipped, completed, canceled, refunded, and more |
The big one to remember: GMV is not your take-home money.
A product can have strong GMV and still be a bad business once you factor in refunds, shipping, discounts, commissions, product cost, and ad spend.
How to Clean TikTok Shop Exported Data
Here is the part nobody loves, but everybody eventually has to do.
Open a copy of the file in Excel or Google Sheets. Leave the original download alone. TikTok exports are your paper trail, so do not overwrite the source file.
First, rename the file in a way that makes sense three months from now. Something like:
US_orders_2026-09-01_to_2026-09-07.csvThen check the order IDs before doing anything else. Excel loves turning long IDs into something like 1.23457E+15, which is useless when you need to match an order later. Format ID columns as text before sorting or saving.
You will probably also find the same product listed under slightly different names. That happens when titles change, bundles get added, or variants are named inconsistently. Create a clean “parent product” column so all related SKUs roll up under one product.
Finally, add a simple week column. It makes weekly comparisons much easier and saves you from rebuilding the same report every Monday.
How to Combine Sales, Affiliate and Refund Reports
You do not need a fancy dashboard to get useful answers.
Start with a simple product-level sheet. One row per SKU or parent product is enough.
Bring in total units sold, GMV, refunds, creator-attributed orders, affiliate commission, and net sales after refunds. From there, the weak spots become easier to see.
A few basic calculations go a long way:
Net sales after refunds = Gross sales - Refund amountRefund rate = Refunded orders ÷ Completed orders × 100Affiliate commission rate = Affiliate commission ÷ Affiliate-attributed GMV × 100You may find a product that sells well but has an ugly refund rate. Or a creator whose commission costs are eating too much of the margin. Those are the numbers worth acting on.
Common Missing Data and Export Problems
Sometimes the export button is missing. Sometimes it works, but the file is empty. Sometimes the dashboard says one thing and the CSV says another.
Before assuming TikTok has a bug, check the date range.
A lot of reporting confusion comes down to timing. One report may use the paid date, while another uses shipment date, delivery date, or settlement date. The totals can be different without either report being wrong.
Also check your filters. It is surprisingly easy to export only one order status, one product category, or one traffic source without realizing it.
If an export is large and fails, try a shorter date range. If the file is still processing, check Export History before downloading it again.
Finance reports can look especially confusing because they include fees, refunds, adjustments, and settlement logic. TikTok Shop’s settlement report is designed for that purpose and can be exported by date range from the finance section. TikTok Shop’s settlement-report guide explains the current process.
Seller Center Data vs Market and Competitor Data
Seller Center gives you the truth about your own shop.
It shows your orders, sales, refunds, product results, and affiliate activity. What it cannot tell you is what your competitors are doing outside your account.
Maybe another shop is suddenly gaining traction with a similar product. Maybe a creator in your niche is driving sales for multiple brands. Maybe a category is growing before it becomes obvious in your own numbers.
To research competitor products, shops, creators and market trends, explore the TikTok Shop data available through EchoTik.
Your shop exports tell you what happened. Market data helps you see what might happen next.
Weekly TikTok Shop Reporting Workflow
The easiest reporting system is the one you will actually keep using.
Once a week, export paid orders, product performance, affiliate results, and refund data. Add the new files to the same master sheet. Then spend 20 minutes looking for movement instead of trying to build a perfect dashboard.
Ask a few straight questions:
Which product brought in the most completed sales?
Which SKU had the worst refund rate?
Did any creator drive orders that actually stayed completed?
Did sales go up because of more traffic, better conversion, or a discount?
Is there a product that deserves more stock, better content, or less budget?
That is enough to make a useful next move.
Frequently Asked Questions
Can I export TikTok Shop orders to CSV?
Yes, many Seller Center order views include an Export option. The available fields and file type can vary by market, report, and account permissions.
How do I download TikTok Shop sales data?
Open the sales, product, order, or finance report you need in Seller Center. Set your filters and date range, then use Export or Download. If the file is not ready right away, check Export History.
Can I export TikTok Shop affiliate data?
Many accounts can export affiliate or creator-performance data. Available metrics depend on your market, account role, and reporting view.
Why does my sales report not match my settlement report?
They may be using different timing and calculation rules. Sales reports often focus on paid orders or GMV. Settlement reports account for fees, refunds, adjustments, and payout status.
What is the best way to analyze a TikTok Shop CSV?
Start with product-level sales, refunds, and creator-attributed orders. Keep the reporting period consistent, then compare products week over week.
How often should I export TikTok Shop data?
Weekly is a practical rhythm for most sellers. Shops with high order volume may export fulfillment data daily while reviewing product, creator, and refund performance once per week.