How to Find TikTok Shop Sales Data and Use It to Make Better Decisions

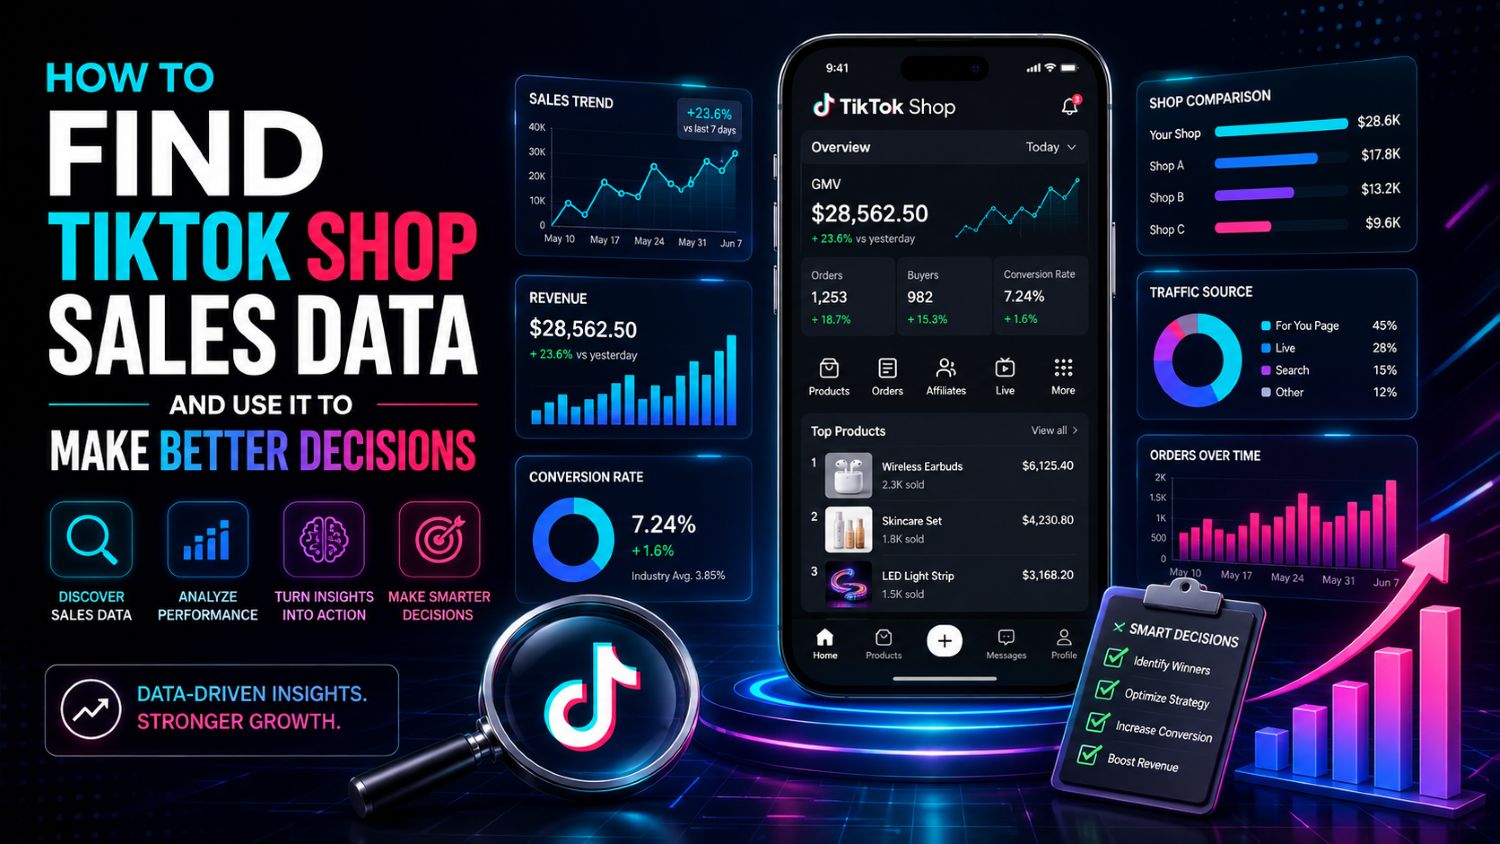
TikTok Shop sales data can tell you which products are selling, how quickly demand is changing, and who is driving the sales.
The hard part is knowing where to find the data and what it really means.
TikTok Seller Center gives you data from your own store. A market analytics platform such as EchoTik helps you research products, creators, shops, videos, and live streams across the wider market.
This guide explains how to use both.
For a complete breakdown of available metrics, read our main guide to TikTok Shop data.
Quick Answer
You can find your own TikTok Shop sales data in TikTok Seller Center.
It normally includes orders, GMV, units sold, product views, conversion rates, traffic sources, affiliate results, and refunds.
To research products or competitors outside your own store, you need market-level data. EchoTik provides estimated GMV, sales trends, product rankings, creator activity, shop performance, shoppable videos, and live-stream data.
Use first-party data to improve your store.
Use market data to decide what to sell, which competitors to watch, and which creators to contact.
Why Sellers Look for TikTok Shop Sales Data
Most sellers are trying to answer one of five questions:
Which products are selling now?
Is demand growing or falling?
Which shops control the market?
Which creators are generating sales?
Is this product worth testing?
A sales number alone cannot answer all five.
You need to connect product sales with time, shops, creators, content, competition, and margin.
Two Types of TikTok Shop Sales Data
Before opening a dashboard, decide which type of data you need.
1. Your Own Shop Data
Your own shop data comes from TikTok Seller Center and authorized reports.
It may include:
GMV
Orders
Units sold
Product impressions
Product page views
Conversion rate
Traffic sources
Affiliate sales
Advertising performance
Cancellations
Refunds
This data is usually the best source for measuring your actual business performance.
It can help you find weak product pages, strong traffic sources, profitable creators, and products with high return rates.
However, it does not show the full market.
You cannot use your Seller Center account to see the private order data of a competing shop.
2. Market and Competitor Data
Market data helps you research products and shops outside your own account.
Depending on the platform and available market, you may be able to check:
Product estimated GMV
Estimated units sold
Shop estimated GMV
Product ranking movement
Category trends
Product prices
Related creators
Shoppable video activity
Live-room performance
Competitor product portfolios
This information is useful for product research and market comparison.
It should not be treated as the competitor’s audited financial statement.
Where Can You Find Your Own TikTok Shop Sales Data?
Start in TikTok Seller Center.
The exact menu can vary by market and account type, but the main analytics areas normally cover shop, product, content, affiliate, traffic, and transaction performance.
Shop Analytics
Shop Analytics gives you an overall view of the store.
Check:
Total GMV
Orders
Units sold
Buyers
Traffic
Conversion
Refund activity
Do not stop at total GMV.
Compare the current period with the previous period. Find out whether the change came from more traffic, better conversion, a higher order value, or one unusually successful product.
Product Analytics
Product Analytics helps you see which listings generate sales.
Review:
Product impressions
Product page views
Orders
Units sold
GMV
Conversion rate
Refunds
Stock status
A product with high traffic and weak conversion may have a listing, price, review, or trust problem.
A product with lower traffic but strong conversion may deserve more content and creator support.
Content Analytics
Content data helps you connect videos and live streams with product activity.
Check:
Video views
Product clicks
Orders
Sales
Live-room traffic
Live conversions
Do not assume that the video with the most views created the most revenue.
A smaller video can be more valuable if it reaches people who are ready to buy.
Affiliate Analytics
Affiliate data helps you evaluate creator performance.
Look at:
Creator-generated orders
Creator GMV
Samples sent
Published content
Commission
Refunds
Cost per successful collaboration
Follower count should not be your main selection rule.
A relevant creator with a smaller audience may generate more sales than a large creator with weak product fit.
Where Can You Find Competitor TikTok Shop Sales Data?
You cannot access a competitor’s private Seller Center.
You can use public market signals and third-party estimates to understand the competitor’s direction.
With EchoTik E-commerce Analysis, you can research products, shops, categories, creators, and content in supported TikTok Shop markets.
Useful competitor fields may include:
Shop estimated GMV
Shop sales movement
Leading products
Product estimated GMV
Product prices
Related creators
Shoppable videos
Live-stream activity
Product ranking movement
The goal is not to copy the competitor.
The goal is to understand how it creates sales.
What TikTok Shop Sales Metrics Matter Most?
More data does not always lead to a better decision.
Start with metrics that change what you do next.
1. GMV
GMV is the total value of products sold during a selected period.
It helps you understand the size of product or shop activity.
GMV does not equal profit.
It does not subtract product cost, shipping, platform fees, creator commission, advertising, discounts, refunds, or customer support.
Use GMV to:
Compare products
Compare shops
Measure sales direction
Find large opportunities
Prioritize deeper research
Do not use GMV to:
Assume profitability
Estimate a competitor’s net income
Order large amounts of stock without more research
2. Units Sold
Units sold help you separate order volume from product price.
A high-priced product can generate strong GMV with fewer orders. A low-priced product may need thousands of sales to reach the same result.
Compare GMV and units together.
This gives you a clearer idea of price, demand, and operating workload.
3. Sales Growth
Sales growth shows whether demand is improving or weakening.
Compare:
Today with yesterday
This week with last week
The last seven days with the previous seven days
The last 30 days with the previous period
Steady growth is usually easier to trust than one large spike.
A spike may come from a viral video, large creator, flash sale, or live-stream event.
4. Product Ranking Movement
A product moving up a category ranking may be gaining attention.
Check whether the ranking movement is supported by actual sales signals.
Also look for:
New creators
New shoppable videos
More competing shops
Live-stream activity
Price changes
A ranking increase is a research signal.
It is not proof that the product will continue growing.
5. Shop Concentration
Find out how much of the product’s activity comes from the leading shop.
If one shop controls most sales, it may have advantages you cannot reproduce.
These may include:
Strong brand recognition
Thousands of reviews
Exclusive supply
Lower prices
Large creator network
Faster shipping
Frequent live streams
A product sold successfully by several shops may offer a more repeatable opportunity.
Too many shops, however, can signal saturation.
6. Creator Concentration
A product may appear successful because one creator generated most of the sales.
That does not mean other creators can repeat the result.
Check:
Number of active creators
Sales distribution
Creator category fit
Repeat promotions
Video performance
Live-selling activity
A product supported by several relevant creators is normally easier to scale.
7. Refund and Return Data
Sales are only useful if customers keep the product.
Review your own refund and return data carefully.
High returns can be caused by:
Poor product quality
Incorrect sizing
Misleading videos
Delivery damage
Unclear instructions
Slow shipping
Unrealistic claims
A product with strong GMV and high refunds may be a weak business.
How Accurate Are TikTok Shop Sales Estimates?
Your own authorized Seller Center data and third-party estimates are different.
Seller Center provides first-party information from your shop account.
Third-party platforms may analyze public product, shop, creator, video, and live-stream signals. They may use estimation methods to calculate market activity.
Estimated sales data is useful for:
Comparing products
Comparing shops
Tracking trends
Finding competitors
Researching categories
Building product shortlists
It should not be used as audited revenue.
A safer way to write and use the data is:
The product recorded an estimated GMV range of $500,000 to $600,000 during the selected period.
Avoid claiming that a competitor made exactly $550,000 unless you have access to verified first-party records.
How to Research a Product Using Sales Data
Here is a simple workflow you can repeat.
Step 1: Select One Market
Choose the country where you plan to sell.
Do not combine US, UK, Southeast Asian, and European products into one shortlist.
Customer demand, prices, shipping, creators, and competition vary by market.
Step 2: Select a Category and Price Range
“Popular TikTok products” is too broad.
Use a clear target, such as:
US beauty tools under $30
UK kitchen appliances
Thailand personal-care products
Malaysia beauty bundles
Mexico mobile accessories
This makes the comparison more useful.
Step 3: Find Products With Recent Sales
Open EchoTik E-commerce Analysis.
Filter by country, category, price, and time range.
Save 10 to 20 products with recent activity.
Do not choose the final product yet.
Step 4: Compare Sales Periods
Look at daily and weekly movement.
Ask:
Are sales growing?
Are they stable?
Was there one large spike?
Did sales continue after the spike?
Is the product ranking improving?
Remove products that are already falling without a clear reason to recover.
Step 5: Check the Shops
Find the shops selling each product.
Compare:
Estimated GMV
Prices
Product listings
Reviews
Bundles
Leading products
Creator activity
Live activity
Look for growing smaller shops.
They can show whether demand exists beyond one large seller.
Step 6: Check the Creators
Find the creators promoting the product.
Do not only look at the largest account.
Check whether several creators can generate product activity with different content styles.
This is a stronger sign that the product can scale.
Step 7: Study the Videos
Open the shoppable videos connected to the product.
Break them into:
Hook
Problem
Demonstration
Proof
Offer
Call to action
Look for patterns that appear in several selling videos.
Do not copy the video. Use the pattern to build your own angle.
Step 8: Check Live Sales
If the product requires explanation, study related live rooms with EchoTik Live Monitor.
Check:
Featured products
Estimated live GMV
Audience trend
Product order
Host scripts
Viewer questions
Offers
Traffic peaks
This can show you how the product is explained before the purchase.
Step 9: Read Reviews and Comments
Find repeated buyer concerns.
Pay attention to:
Quality
Size
Shipping
Instructions
Results
Packaging
Missing features
Refunds
Use the feedback to improve the offer—or reject the product.
Step 10: Calculate Profit
Add every major cost:
Product cost
Packaging
Shipping
TikTok Shop fees
Creator commission
Samples
Discounts
Advertising
Refunds
Returns
Customer service
High sales do not fix a weak margin.
Step 11: Run a Small Test
Start with limited inventory.
Test several creators and content angles.
Track your actual:
Traffic
Clicks
Conversion
Orders
Creator cost
Refunds
Profit
Your first-party test data should make the final decision.
A Real Example From EchoTik Weekly Data
In the US TikTok Shop ranking for July 20–26, 2026, medicube US Store recorded estimated GMV of $12.4 million to $15.2 million.
The leading product ranking included:
medicube PDRN skincare product: $2.8M–$3.4M
Die-cast car models: $2.3M–$2.9M
Trading-card storage accessory: $1.5M–$1.8M
The numbers show demand in beauty.
They also reveal opportunities in collectibles and storage products.
These products support unboxing, comparison, collecting, demonstration, and community content.
That is more useful than simply saying, “Beauty was number one.”
It gives sellers several product and content directions to research.
Source: EchoTik weekly ranking data, July 20–26, 2026. GMV figures are estimates used for market comparison and trend analysis.
How to Use Sales Data for Competitor Analysis
Start with the competitor’s leading products.
Find out whether the shop depends on one hero product or has several strong products.
Then check:
Product launches
Price changes
Creator partnerships
Video frequency
Live-stream schedule
Bundles
Category expansion
Ranking movement
A competitor’s activity can reveal strategy changes.
For example:
More creator videos may signal a new campaign.
Lower prices may signal a promotion or inventory problem.
New related products may signal category expansion.
More live streams may show that the product needs explanation.
Track the changes over time.
One screenshot gives you a result. Repeated monitoring gives you the strategy behind it.
How to Use Sales Data for Creator Selection
A creator should be evaluated by more than follower count.
Check:
Relevant products promoted
Estimated sales activity
Content consistency
Category fit
Audience comments
Live-selling experience
Competitor partnerships
Repeat performance
Look for creators whose normal content already matches the product.
The promotion should feel natural.
If a creator normally posts unrelated entertainment content, a product video may receive views without producing many sales.
When Do You Need a TikTok Shop Data API?
A dashboard is enough for most sellers.
An API becomes useful when your team needs to collect or update data automatically.
Common uses include:
Automated competitor reports
Internal product research dashboards
Creator databases
Product alerts
Category monitoring
Live-commerce tracking
Client reporting
SaaS features
The EchoTik Data API provides structured access to product, shop, creator, video, live-stream, and market data.
Before choosing an API, check:
Available markets
Data fields
Update frequency
Historical coverage
Rate limits
Documentation
Export formats
Support
Usage rights
Do not pay for more data than your team can use.
Common Mistakes
Using views as sales data
Views measure attention.
They do not prove orders or profit.
Looking only at lifetime sales
A product may have strong historical sales but weak current demand.
Check recent movement.
Ignoring shop concentration
One large shop may create most of the market’s sales.
Find out whether smaller sellers can compete.
Ignoring creator concentration
One viral creator can make a product look stronger than it is.
Look for several creators generating activity.
Comparing different markets
A product that works in Indonesia may not work in the UK.
Research each country separately.
Treating estimates as exact revenue
Third-party GMV should be used for comparison and direction.
Do not present it as audited income.
Forgetting refunds
A product can generate strong sales and still lose money.
Track what happens after the order.
Practical Takeaways
Use Seller Center for your own shop data.
Use market analytics for products and competitors.
Compare recent sales periods.
Check whether one shop controls the market.
Find products supported by several creators.
Study the videos behind the sales.
Use live data for products that need demonstrations.
Treat third-party GMV as an estimate.
Calculate profit before buying inventory.
Run a small test before scaling.
Sales data should help you make one clear decision:
Test, monitor, improve, or reject.
FAQ
Where can I see my TikTok Shop sales?
You can see your own shop sales in TikTok Seller Center.
Review your shop, product, content, affiliate, traffic, and transaction analytics.
Can I see another TikTok Shop’s sales?
You cannot access another seller’s private account data.
Third-party analytics platforms can provide estimated GMV, product movement, shop rankings, creator activity, and other public market signals.
What is TikTok Shop GMV?
GMV is the total value of products sold during a selected period.
It is a sales metric, not a profit metric.
Are EchoTik sales figures exact?
EchoTik market figures should be treated as estimates.
They are useful for comparing products, shops, creators, and market direction. They are not audited financial statements.
What is the most important TikTok Shop sales metric?
There is no single best metric.
Start with recent sales growth, then check shop concentration, creator activity, content performance, refunds, and margin.
Can TikTok Shop sales data help find winning products?
It can help identify products that deserve more research.
You still need to check competition, quality, logistics, creator fit, reviews, policy risk, and profit before testing.
How often should I check TikTok Shop sales data?
Check your own active campaigns and important products daily.
Review product, creator, competitor, and category trends weekly. Use monthly reviews for larger strategy decisions.
Can I export TikTok Shop data?
TikTok Seller Center supports exports for certain reports.
Third-party dashboards and APIs may also provide exports or structured access, depending on the service and plan.
Final Thoughts
The biggest sales number is not always the best opportunity.
Look at the direction of sales, the shops behind them, the creators driving them, and the content producing the demand.
Then check whether the economics work for your business.
For a broader explanation of products, shops, creators, videos, live streams, APIs, and market metrics, read the complete TikTok Shop data guide.
Use EchoTik to research TikTok Shop sales data before choosing your next product, creator, or market.