How to View the TikTok Store in 2025

Wondering how to see tiktok shop analytics? You just open your Profile, tap the three-line icon, and select TikTok Studio under Monetization. Analytics matter for your shop’s growth. When you check your dashboard, you can:
Track how your shop grows and spot problems fast
Make smarter choices for marketing with real data
See what your audience likes and improve your products
If you use tiktok shop analytics often, you keep your shop moving forward.
Key Takeaways
To see TikTok Shop analytics, go to your profile. Tap the three-line icon. Choose TikTok Studio under Monetization.
Check your analytics dashboard often. This helps you track sales. You can also see audience engagement. You can view product performance. This helps you make better choices.
Use custom views and filters on the dashboard. These help you look at data in different ways. You can sort by dates, regions, or product types.
Watch important metrics like net sales and conversion rates. Also check customer engagement. This helps you spot trends. It can help you make your shop better.
If you have trouble getting to your dashboard, update your app. You can also try switching to a Creator or Business account.
Access TikTok Shop Analytics
How to See TikTok Shop Analytics?
You want to know how to see tiktok shop analytics? You’re not alone. Many shop owners ask this question every day. The process is simple, but you need to follow the right steps. Here’s how to see tiktok shop analytics? in the 2025 version of the app:
Open the TikTok app and go straight to your profile.
Tap the three-line icon in the top right corner.
Find and select TikTok Studio under the Monetization section.
Now you can access tiktok shop analytics and see your shop’s performance.
If you follow these steps, you’ll get a clear view of your shop’s growth, sales, and audience engagement. You can check how to see tiktok shop analytics? whenever you want. This dashboard helps you spot trends and make smart decisions for your business.
Access the Dashboard
After you reach TikTok Studio, you’ll see the dashboard. This is where you find all your shop’s important data. You can access the dashboard to track sales, see which products perform best, and understand your audience. The dashboard updates in real time, so you always get fresh insights.
Sometimes you need more than what the main app offers. You can use alternative methods to access tiktok shop analytics. Here’s a quick comparison:
Method | Features | Differences from Main App |
|---|---|---|
Seller Center | Real-time performance data, Shop Insights for traffic and sales analysis | Provides basic metrics and insights, requires external tools for deeper analysis |
Data Compass | In-depth insights into sales and campaign performance | Offers a holistic view of business performance not available in the main app |
You can also use tools like Hootsuite or Sprout Social to track sales and order volume. Brand24 helps you analyze audience demographics. Exolyt focuses on TikTok-specific engagement metrics. These platforms give you extra ways to access tiktok shop analytics and understand your shop’s data.
Tip: Make sure your TikTok app is updated to the latest version. Some features may look different in 2025. If you use an older device, you might not see all analytics options. Try updating your app or switching to a newer phone or tablet for the best experience.
You now know how to see tiktok shop analytics? and access tiktok shop analytics from different places. Use these tools to keep your shop growing and stay ahead of the competition.
TikTok Shop Data Dashboard
Dashboard Overview
When you open the tiktok shop data dashboard, you see all your shop’s important numbers in one place. You can quickly check sales, customer activity, and which products are trending. The dashboard updates right away, so you always know what is happening. You can look at how your products are selling. You can see which campaigns help your shop the most. You can also watch how your videos get shoppers interested.
Here’s what you’ll find on the analytics dashboard:
All your shop’s data in one spot
Shows how your shop is doing and growing
Gives sales numbers for each product
Watches how customers react and what they say
Looks at product trends to find what’s popular
You can see how your shop compares to others and check if your content does well. The dashboard also shows how people interact with your shop and how influencer marketing works. This makes tiktok shop analytics different from places like Shopify or Amazon.
Key Metrics
The analytics dashboard helps you look at the most important numbers. You can see how your products do over time and watch your shop grow. Here are the main things you can track:
Metric | Description |
|---|---|
Net Sales | Total net sales of the product in the selected period. |
Units Sold | Total number of units sold within the selected period. |
Ad Spend | Total advertising expenses for each product. |
Net Profit | Final net profit of each product sold. |
Net Profit Margin | Percentage of sales revenue after deducting all costs. |
These numbers help you make good choices and help your shop do better.
Custom Views
The tiktok shop data dashboard lets you change how you see your shop’s data. You can pick different dates, days, places, ages, post types, and video lengths. You can also move, group, or resize the charts to fit what you want.
Tip: Try using different filters to see how your shop does with new groups or during special times.
The dashboard keeps your data safe with AES-256 encryption. You get to control who can see what, keep accounts separate, and follow privacy rules like GDPR and CCPA. You can manage your data in the app or ask for help, so you always have control.
Use TikTok Shop Analytics
Track Sales and Revenue
You want to know how your shop does each day. Tiktok shop analytics lets you see sales and revenue in one spot. The dashboard shows important sales numbers like total sales, order count, and profit margins. You can find out which products sell the most and which need help. Here’s what you can track:
Feature | Description |
|---|---|
Marketplace Performance | Check main sales numbers for any time using one dashboard. |
Product Performance | Find bestsellers and products that do not sell well. |
Profit Tracking | See profit margins, sales success, and business profits. |
Customer Insights | Learn about buyers by region and spot sales trends. |
Many sellers use one analytics tool to get revenue data from tiktok shop and other places. You can also use features like predictive analytics and customer journey mapping. These tools help you make smart choices and grow your shop.
Analyze Customer Behavior
Tiktok shop analytics helps you see how shoppers act in your store. You can track customer engagement by checking click-through rates and conversion rate. These numbers show what gets attention and what leads to sales. You can also see which products get the most clicks or likes. This helps you know what your audience likes and what makes them buy.
Focus on engagement, audience, and sales numbers.
Use detailed sales reports to find trends and see which products connect with customers.
Change your plan by watching how people interact with your shop.
When you use audience insights, you can change your marketing to fit what your customers want. This helps you keep up with trends and grow your shop.
Product Performance Insights
You can use tiktok shop analytics to see which products do well and which need work. The dashboard lets you filter by conversion rate, so you can spot top sellers fast. If a product has a low conversion rate, try changing the title or adding customer reviews. For high conversion rate items, you might test higher prices or run tiktok ads to reach more people.
Insight Type | Description |
|---|---|
Make campaigns better with insights on promotion and engagement. | |
Market Insight | Learn about tiktok trends, competitors, and new chances. |
Product Research | Find top items and spot trends on tiktok shop. |
You can also make a content performance spreadsheet to track what works best. Post when your audience is most active. Show your best products in your shop. Try different content styles and use audience insights to keep getting better.
Tip: Use tiktok shop analytics often. The more you check your data, the faster you can spot problems and make changes that boost your sales.
Troubleshoot Access Issues
Dashboard Not Loading
Sometimes, you open the dashboard and nothing happens. This can feel frustrating, but you can fix it with a few easy steps. Here’s what you should try:
Switch to a Pro account. Make sure you use a Creator or Business account to see analytics.
Check if tiktok has server problems. Sometimes, the dashboard will not load if the servers are down.
Clear your app cache and data. This refreshes the app and can fix small glitches.
Update your tiktok app. The latest version often works better and has fewer bugs.
Wait a bit. Sometimes, the dashboard needs time to refresh and show new data.
If you follow these steps, you can usually get the dashboard working again.
Tip: Always keep your app updated. This helps you avoid many common problems.
Data Missing or Delayed
You may notice that some data does not show up right away on your dashboard. This happens to many shop owners. Data can take time to appear because of how tiktok processes information. Here’s a quick look at how long it might take for your data to show:
Postback | Attribution Window | Random Delay | Max Delay from Install |
|---|---|---|---|
Postback 1 | 0–2 days | 1–2 days | 4 days |
Postback 2 | 3–7 days | 1–6 days | 14 days |
Postback 3 | 8–35 days | 1–6 days | 41 days |
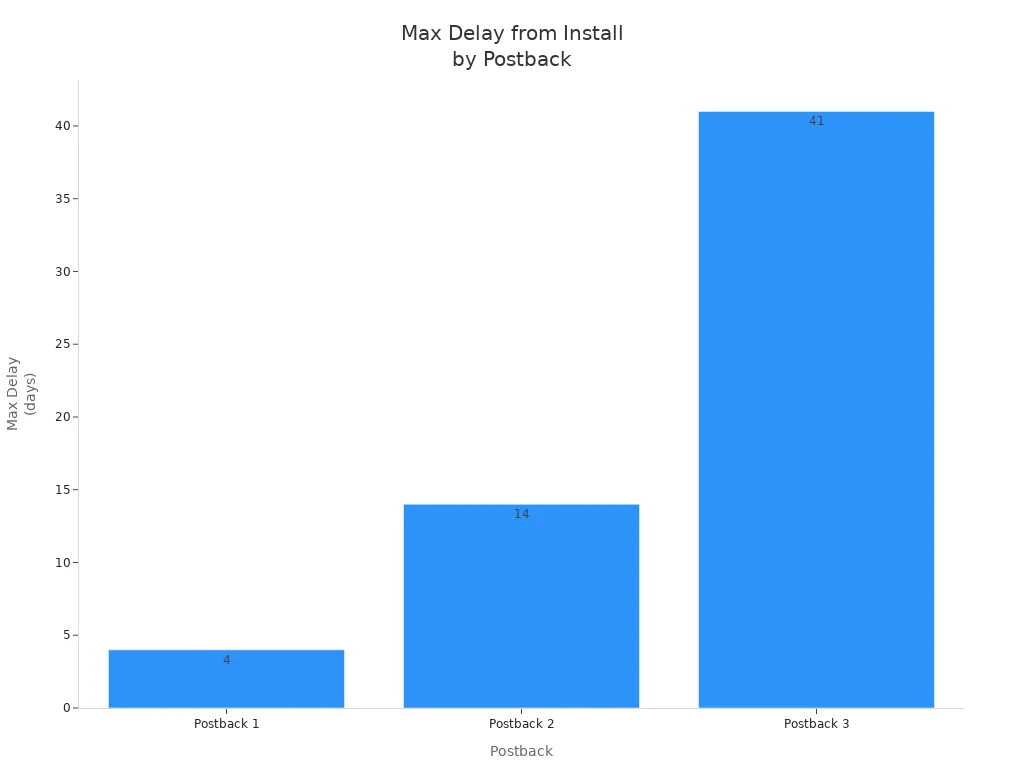
If your dashboard still does not show the latest data, wait a few days. Most data will appear after the delay.
Contact Support
If you still cannot access your dashboard or see your data, you may have a different problem. Here are some common issues and what you can do:
Common Issue | Description |
|---|---|
Forgot Password | Reset your password using the 'Forgot Password' link on the login page. |
Account Locked | Wait a while or contact support if your account is locked after failed logins. |
Regional Login Issues | Make sure you use the correct regional version of the TikTok Shop Seller Center. |
If none of these steps work, reach out to tiktok support. Go to the Help Center in the app or use the Seller Center website. Explain your problem clearly. Support can help you get back into your dashboard and see your data.
You can access your TikTok Shop analytics by heading to your profile, tapping the three-line icon, and choosing TikTok Studio. Checking your dashboard often helps you spot trends and make smart changes. Take a look at this table to see how regular monitoring boosts shop success:
What You Do | How It Helps Your Shop |
|---|---|
Spot trends and adapt quickly | |
Track customer interactions | Improve sales-driving content |
Use data for decisions | Grow your shop with real insights |
Want to get the most from your dashboard?
Create custom dashboards for real-time updates.
Run monthly reports to stay ahead.
If you run into trouble, update your tiktok app and check your account type. Regular checks keep your shop moving forward.
FAQ
How often does TikTok update shop analytics data?
You usually see updates in real time. Sometimes, you might notice a short delay. Most sales and engagement numbers refresh every few minutes. If you do not see new data, try refreshing the dashboard or checking back later.
Can you export TikTok Shop analytics reports?
Yes, you can export your analytics. Just look for the export or download button on your dashboard. You get your data as a CSV file. This makes it easy to review your shop’s numbers in Excel or Google Sheets.
Why can’t you see TikTok Shop analytics on your account?
You need a Creator or Business account to view analytics. If you use a personal account, you will not see the dashboard. Switch your account type in settings. Also, make sure your app is up to date.
What should you do if your analytics seem wrong?
Check your internet connection first. Try logging out and back in. Sometimes, TikTok needs time to process new data. If the numbers still look off, contact TikTok support for help.
Which metrics matter most for shop growth?
Metric | Why It Matters |
|---|---|
Net Sales | Shows your total earnings |
Conversion Rate | Tells you what sells best |
Engagement | Measures customer interest |
Focus on these numbers to grow your shop faster.
See Also
Ways To Access Analytics For Your TikTok Account
Essential Tools For Analyzing Your TikTok Performance
Comprehensive Guide To Analyzing TikTok Shop Data Effectively