TikTok Analytics Metrics Explained

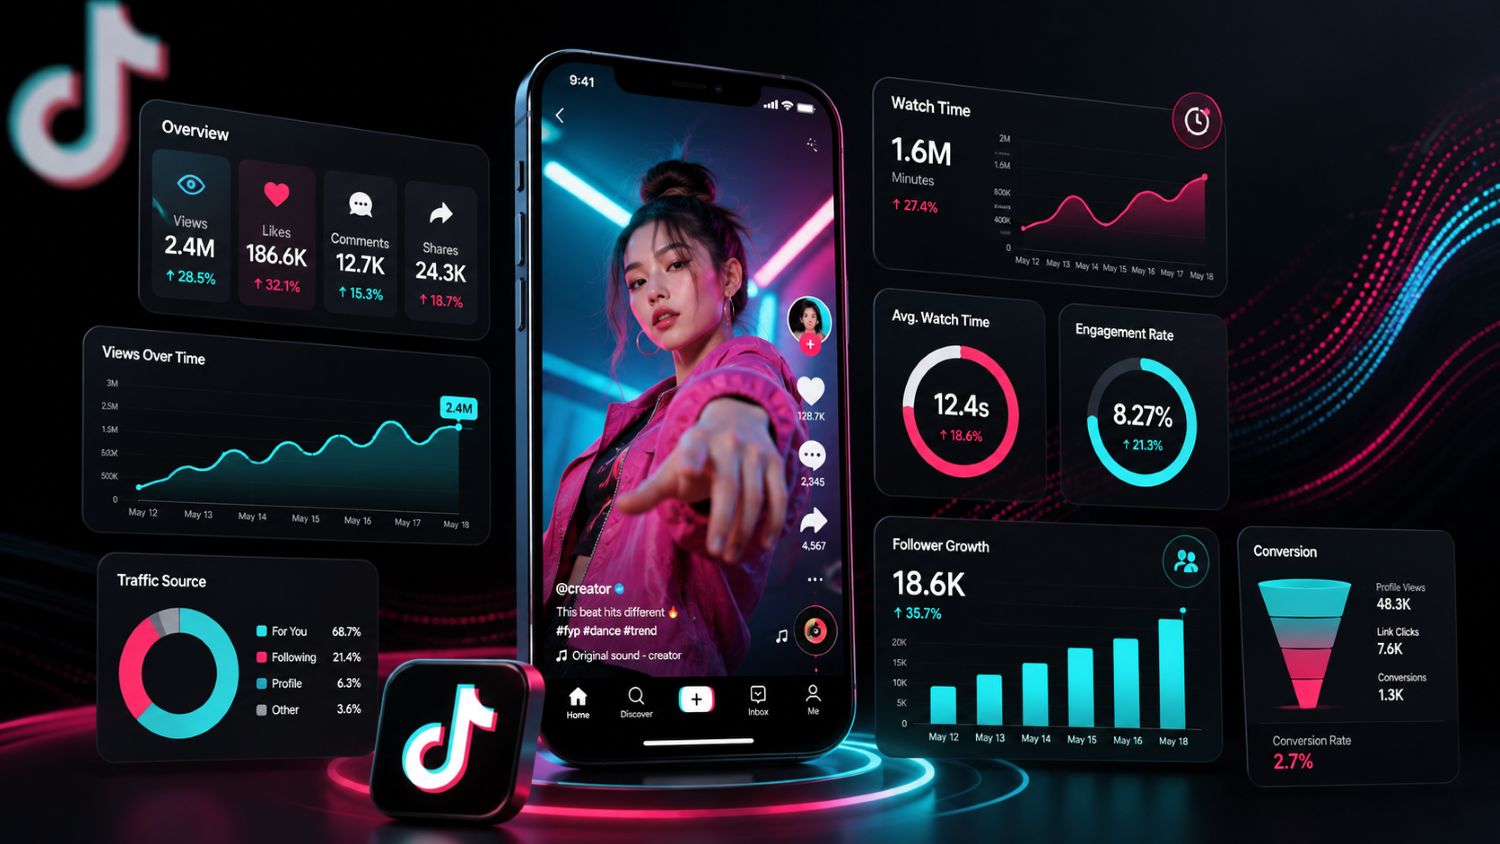
TikTok analytics metrics tell you more than whether a video went viral.
They show whether viewers stopped scrolling, watched the video, reacted to it or visited your profile. For sellers, they can also show whether content led to product clicks and sales.
Do not track every number just because it is available.
Focus on the metrics that explain what viewers did and what you should change next.
For a broader comparison of platforms that help you track accounts, creators and content, review these TikTok analytics tools.
Why TikTok Analytics Metrics Matter
Views are useful, but views alone do not explain performance.
A video may get many views because TikTok tested it with a wide audience. If viewers leave quickly, the video may not keep growing.
Analytics helps you find the reason behind the result.
You can see whether your hook worked, whether people watched to the end and whether the video created real interest.
The goal is simple: make better decisions for the next video.
Video Views
Views show how many times a video was watched.
They are usually the first metric people notice. But a high view count is not always a strong result.
Compare views with watch time, likes, shares and profile visits.
For example, a video with 100,000 views may look successful. But if viewers watch only two seconds and do not engage, it may not help your account or business.
Use views to measure reach. Use the other metrics to measure quality.
Average Watch Time
Average watch time shows how long people watched your video on average.
This is one of the most useful TikTok analytics metrics because it tells you whether the video held attention.
A low average watch time often points to a weak opening, slow pacing or unclear topic.
To improve it:
Show the result early.
Start with a clear problem or statement.
Remove long introductions.
Use visual changes throughout the video.
Keep the video focused on one idea.
A short video does not need a long explanation. It needs a reason for the viewer to stay.
Video Completion Rate
Completion rate shows how many viewers watched your video to the end.
The formula is simple:
Completion Rate = Full Video Views ÷ Total Video Views × 100
A high completion rate usually means the video was easy to follow and worth finishing.
Short videos often have higher completion rates than long videos. That is normal.
Compare videos with similar lengths. Do not compare a 10-second product clip with a two-minute tutorial and expect the same completion rate.
If your completion rate is falling, check the first three seconds first. That is where most viewers decide whether to keep watching.
Likes, Comments and Shares
Likes, comments and shares show different types of viewer interest.
Metric | What It Usually Signals |
|---|---|
Likes | Viewers enjoyed, agreed with or related to the content |
Comments | The video created questions, opinions or conversation |
Shares | The content was useful, funny or relevant enough to send to someone |
Saves | The viewer may want to revisit the content later |
Shares are often especially valuable.
A viewer who shares a video is telling someone else that it is worth watching. Educational content, relatable content and useful product demonstrations often earn more shares.
For more detail on likes, read our guide to what is a good like rate on TikTok.
TikTok Engagement Rate
TikTok engagement rate helps you compare videos with different view counts.
A simple engagement rate formula is:
Engagement Rate = (Likes + Comments + Shares) ÷ Views × 100
For example, a video with 600 total interactions and 10,000 views has a 6% engagement rate.
Engagement rate is useful because a smaller video can sometimes create a stronger audience response than a larger one.
Do not use it alone.
A high engagement rate with low watch time may still limit reach. A lower engagement rate with strong retention may continue growing.
Review engagement alongside watch time and completion rate.
Follower Growth
Follower growth shows whether your content is turning casual viewers into an audience.
Track:
Followers at the start of the week
Followers at the end of the week
Net new followers
Videos that brought the most follows
Look for the videos that lead to follower growth.
They may not be your highest-viewed videos. Often, a clear tutorial, strong opinion or useful niche video earns more followers because viewers want similar content in the future.
For a practical reporting format, see our TikTok analytics report template.
Profile and Product Clicks
Profile views show that viewers wanted to know more about you.
Product clicks show that content created commercial interest.
For brands and TikTok Shop sellers, these are important metrics. They connect content performance with possible buying intent.
Track:
Profile views
Link clicks
Product clicks
Add-to-cart activity, where available
Orders
GMV
Sales from videos or LIVE sessions
A video with fewer views but more product clicks may be more valuable than a video with large reach and no action.
Creator and Shop Performance
If you work with creators or sell through TikTok Shop, review performance by creator and product.
For creators, compare:
Videos posted
Views
Watch time
Engagement
Product clicks
Sales contribution
Repeat performance
For shops, review:
Top products
Product ranking movement
Estimated GMV
Active creators
Shoppable video activity
LIVE performance
Do not judge a creator by follower count alone.
A smaller creator with steady product clicks may be more useful than a large creator who brings views but no buyer interest.
You can use EchoTik to study products, shops, creators, videos and LIVE commerce in one place.
Which Metrics Should You Track Weekly?
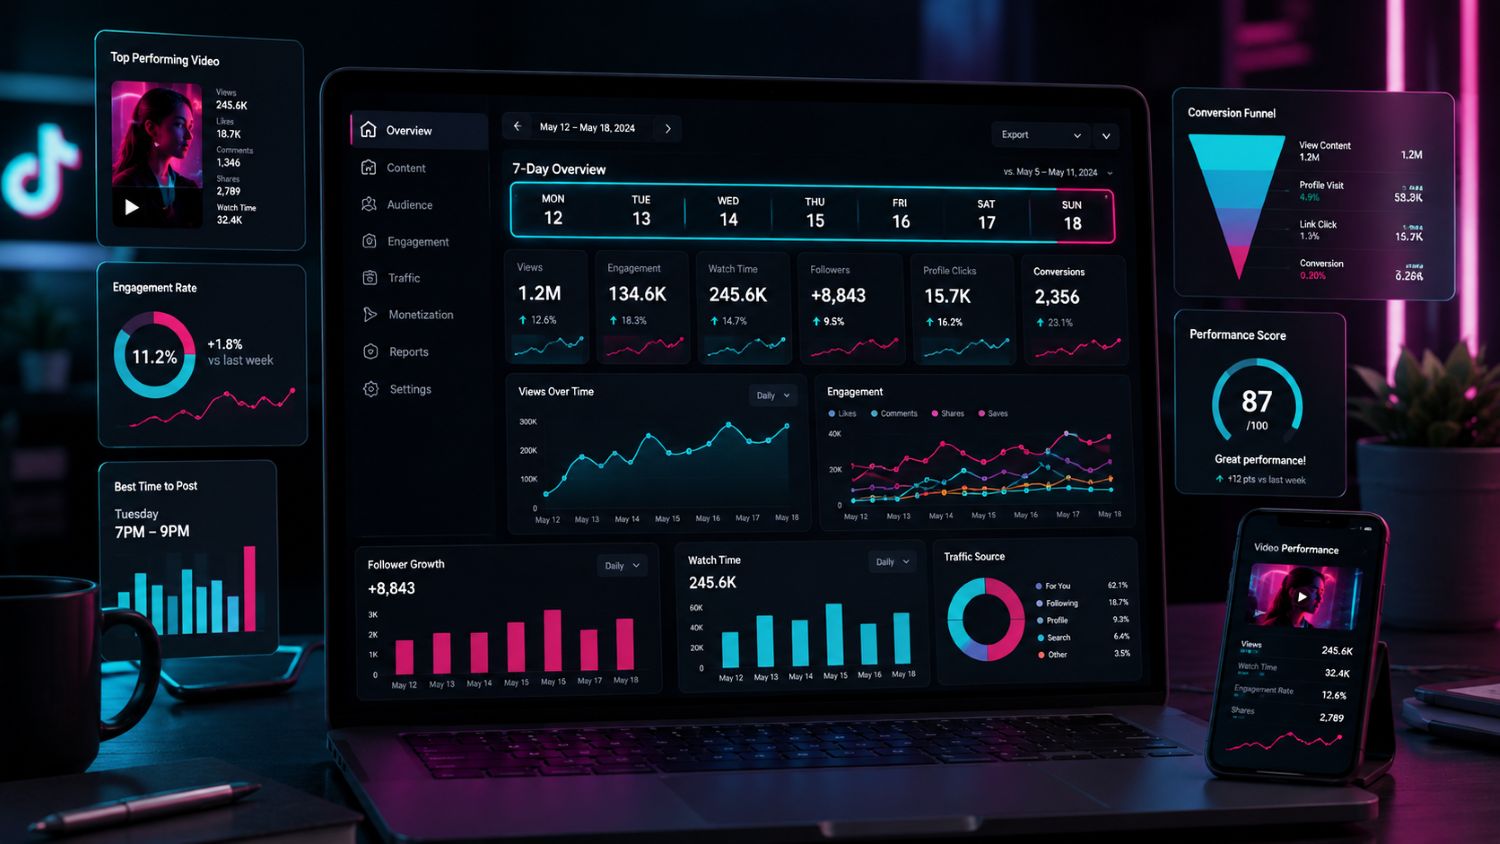
A weekly report does not need to be complicated.
Track these core metrics:
Goal | Metrics to Track |
|---|---|
Reach | Views, unique viewers, profile views |
Content quality | Average watch time, completion rate |
Engagement | Likes, comments, shares, engagement rate |
Audience growth | New followers, follower growth rate |
Conversion | Product clicks, orders, GMV |
Creator campaigns | Posts, views, clicks, sales contribution |
Use the same date range every week.
Then compare what changed. Did your watch time improve? Did one content format bring more followers? Did a creator produce sales rather than only views?
Those answers are more useful than a dashboard full of numbers.
Final Takeaway
The most important TikTok analytics metrics are the ones that help you improve your next decision.
Views show reach. Watch time shows attention. Completion rate shows whether people stayed. Engagement shows audience response. Clicks and sales show commercial value.
Start with a small weekly dashboard.
Find the content patterns that work. Then create more videos that give viewers a reason to stop, watch and act.