How to Analyze TikTok Shop Competitors Using Sales Data

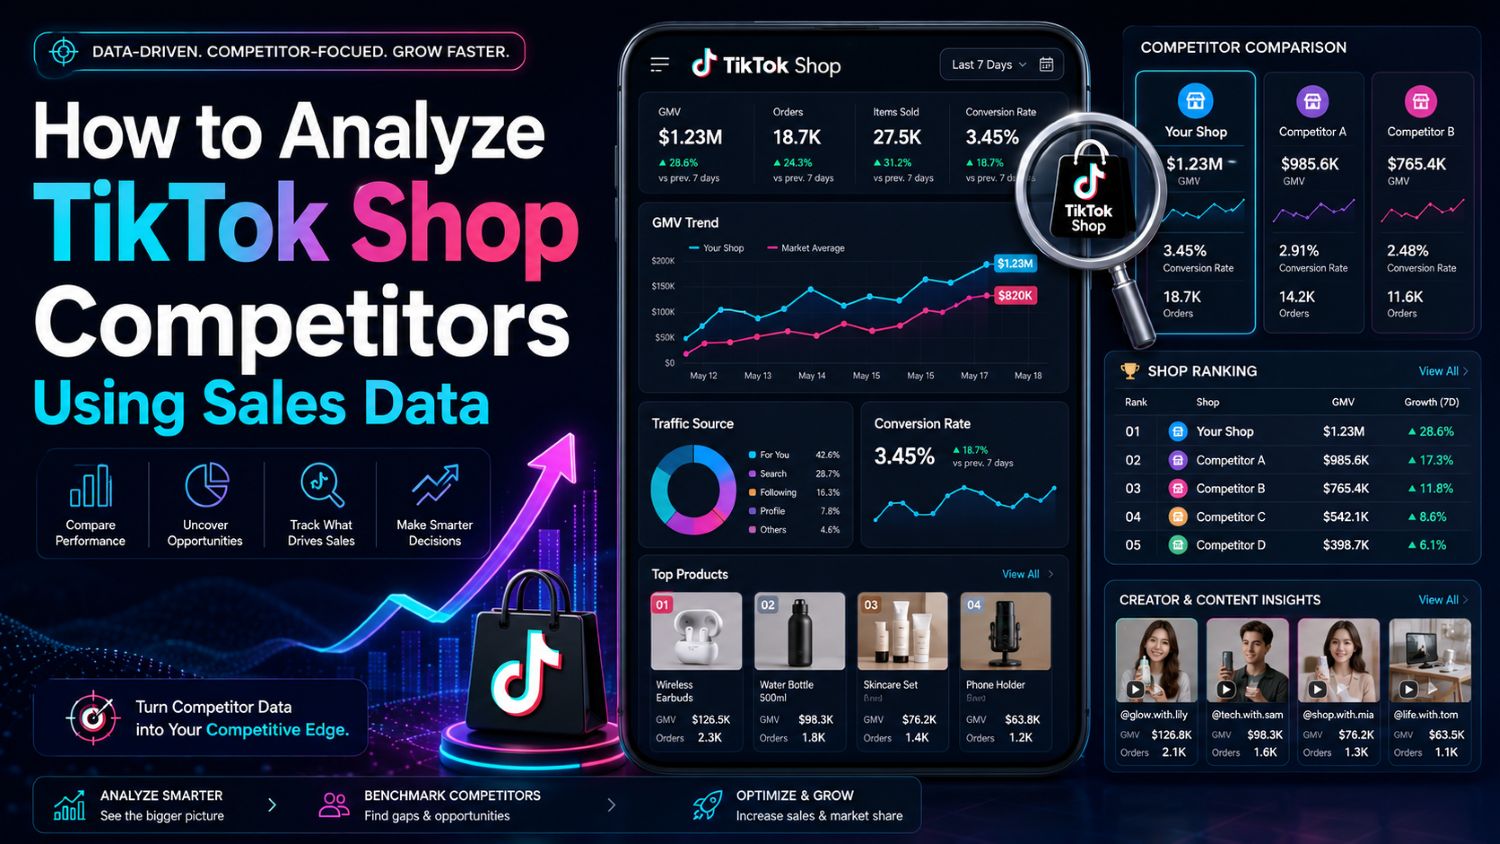
TikTok Shop competitor analysis helps you understand what is selling, who is driving the sales and whether demand is still growing.
Before comparing competitors, review our complete TikTok Shop data guide to understand the available product, shop, creator, video and sales metrics.
Do not judge a competitor by total GMV alone.
A large shop may be slowing down. A smaller shop may have a new product growing quickly across several creators.
The real value comes from connecting sales with products, creators, videos and LIVE activity.
Quick Answer
To analyze TikTok Shop competitors, track:
Estimated sales and GMV
Product growth
Average selling price
Active creators
Shoppable video performance
LIVE commerce performance
Compare the same country and date range.
Then look for patterns. A product supported by rising sales, several creators and consistent content is usually more interesting than one driven by a single viral video.
What Is TikTok Shop Competitor Analysis?
TikTok Shop competitor analysis is the process of studying competing shops using market data.
It helps answer practical questions:
Which products generate most of their sales?
Is the shop growing or declining?
Which creators promote its products?
Does it rely on videos or LIVE selling?
What price range works in the category?
Is one viral product carrying the entire shop?
You are not trying to copy the competitor.
You are using its activity to reduce the risk of your next product, creator or content decision.
What Competitor Data Should You Track?
You do not need every available metric.
Focus on data that explains where sales come from and whether the performance looks repeatable.
Estimated Sales and GMV
Estimated sales show the likely number of products sold. Estimated GMV shows the approximate value of those sales.
Use both metrics for comparison.
A high sales count with low GMV may indicate a low-priced product. A lower sales count with strong GMV may come from a more expensive item.
Remember that competitor figures may be estimates.
They may not include every cancellation, refund, commission or fee. Use them to compare market performance, not to calculate a competitor’s exact profit.
Product Growth
Total sales tell you how large a product has become.
Growth tells you what is happening now.
Compare:
Recent sales
Previous-period sales
Ranking movement
New creator activity
Number of related videos
LIVE promotion frequency
A product with lower total sales but strong recent growth may offer a better opportunity than an established bestseller that has started to decline.
Average Selling Price
Price helps explain the shop’s position.
Calculate or compare the typical selling price of its leading products. Then check whether the shop relies on permanent discounts, bundles or limited offers.
Ask:
Is the shop competing on price?
Are its bestsellers above or below the category average?
Does it raise prices after products gain traction?
Are bundles increasing the order value?
Do not copy a low price before checking your own product cost, shipping and creator commission.
Revenue without margin is not a good opportunity.
Creator Partnerships
Creators can be the main source of a competitor’s growth.
Track:
Number of active creators
Videos published per creator
Products promoted
Recent views and engagement
Estimated creator sales
Repeat partnerships
LIVE activity
Pay attention to concentration.
If one creator generates most of the attention, the shop’s performance may be difficult to repeat. Sales spread across several relevant creators suggest broader demand.
Shoppable Video Performance
Shoppable videos connect content with products.
Review the videos linked to a competitor’s bestsellers and compare:
Views
Likes, comments and shares
Publish date
Creator
Product promoted
Estimated sales
Opening hook
Demonstration style
Do not copy the video word for word.
Identify the structure. A repeated problem-and-solution format may be more valuable than the exact script.
LIVE Commerce Performance
Some shops rely heavily on LIVE selling.
Track:
Number of LIVE sessions
Stream duration
Audience size
Products featured
Estimated orders
Estimated GMV
Host or creator
Discounts used
A shop with average video performance may still produce strong sales through regular LIVE sessions.
If you ignore LIVE data, you may misunderstand the source of its success.
How to Compare Competing TikTok Shops
Choose three to five shops in the same market and category.
Use the same date range for every shop. Comparing one shop’s seven-day performance with another shop’s 30-day performance will not give you a useful result.
Build a simple comparison:
Metric | What It Tells You |
|---|---|
Estimated GMV | Overall market size |
Recent sales growth | Current momentum |
Top-product share | Dependence on one product |
Average selling price | Market position |
Active creators | Strength of affiliate distribution |
Shoppable videos | Content volume |
LIVE performance | Importance of live selling |
Look beyond the largest number.
A competitor with smaller GMV may have faster growth, more active creators and a healthier product mix.
That shop may be more useful to study.
How to Find a Competitor’s Best-Selling Products
Start from the competitor’s shop rather than searching products one by one.
Sort or compare its products by recent sales or estimated GMV.
For each leading product, check:
Recent sales movement
Product ranking history
Current price
Number of active creators
Recent shoppable videos
LIVE appearances
Customer reviews
Competing shops selling similar items
Do not stop at the number-one product.
Review products ranked second to tenth. This is often where you find newer opportunities that have not reached full saturation.
Also check how much of the shop’s GMV comes from its leading product.
A shop that depends on one bestseller has a different strategy from a shop with five products producing steady sales.
How to Find the Creators Driving Competitor Sales
Open the competitor’s leading products and review the creators promoting them.
Separate creators into three groups:
Creators producing strong sales
Creators producing attention but limited sales
New creators whose results are still developing
Then check whether the strongest creators have something in common.
They may share:
A similar audience
A specific content format
A narrow follower range
Strong product demonstrations
Frequent LIVE sessions
Experience in the same category
This gives you a more focused creator profile.
You can then find similar creators instead of contacting random influencers with large follower counts.
How to Use Competitor Data for Product Selection
Competitor data should help you create a shortlist, not make the final decision for you.
A product is worth further testing when several signals agree:
Recent sales are growing
Sales are not dependent on one day
Several creators are active
New videos continue to appear
Customer interest is visible
The price leaves room for margin
Competition is still manageable
Be careful with products that show high GMV but falling growth.
They may still be large, but the best entry point may have passed.
Once you find a candidate, calculate your costs and run a small test.
Competitor performance proves market demand. It does not prove that your own offer will convert.
Common TikTok Shop Data Mistakes
Treating Estimated GMV as Exact Revenue
Competitor GMV may be estimated.
It is useful for market comparison, but it may not equal settled revenue after refunds, discounts and fees.
Looking at Total Sales Without a Date Range
A product may have strong lifetime sales but weak current demand.
Always check recent movement.
Comparing Different Countries
The same product can perform differently in the US, UK, Indonesia or Thailand.
Compare shops within the same market.
Ignoring Creators and Content
Sales numbers show what happened.
Creator, video and LIVE data help explain why it happened.
Copying the Largest Competitor
The market leader may have a larger budget, better supply chain or established creator network.
Study fast-growing shops that are closer to your current size as well.
Relying on One Metric
No single metric proves that a product is worth selling.
Combine sales, growth, price, creator activity and content performance.
How EchoTik Supports Competitor Research
EchoTik lets sellers compare TikTok Shop products, shops, creators, videos and LIVE rooms in one workflow.
You can use it to:
Find competing shops
Review estimated sales and GMV
Identify leading products
Track product rankings
Study creator partnerships
Review shoppable videos
Monitor LIVE rooms
Compare category performance
A practical workflow is simple.
Start with a competitor shop. Find its growing products. Then check which creators, videos and LIVE sessions are supporting those products.
This gives you more context than a sales figure alone.
Use EchoTik E-commerce Analysis to research shops, products and creators.
For LIVE competitor research, use EchoTik Live Monitor.
Frequently Asked Questions
Can I see a competitor’s exact TikTok Shop sales?
You normally cannot access another shop’s private confirmed order data.
Third-party platforms may provide estimated sales and GMV based on available market signals. Use these figures for comparison rather than financial reporting.
What is the most important TikTok Shop competitor metric?
Recent product growth is often more useful than lifetime sales.
Combine it with creator activity, video performance, price and LIVE data before making a decision.
How often should I analyze TikTok Shop competitors?
A weekly review works for most sellers.
Monitor more frequently during a product launch, major promotion or fast-moving category trend.
How do I find a competitor’s best-selling product?
Search for the shop in a TikTok Shop competitor analysis tool. Sort its products by recent sales or estimated GMV.
Then review each product’s growth, creator activity, videos and LIVE performance.
Is TikTok Shop competitor data accurate?
Basic product and content information can be directly observed at the time of collection.
Competitor sales and GMV may be estimated. Their value is in comparing trends and relative performance, not calculating exact revenue.
Analyze TikTok Shop Competitors with EchoTik
Do not choose a product based on one sales number.
Use EchoTik to connect competitor sales with products, creators, shoppable videos and LIVE performance.