2026 TikTok Shop Data Trends and Statistics

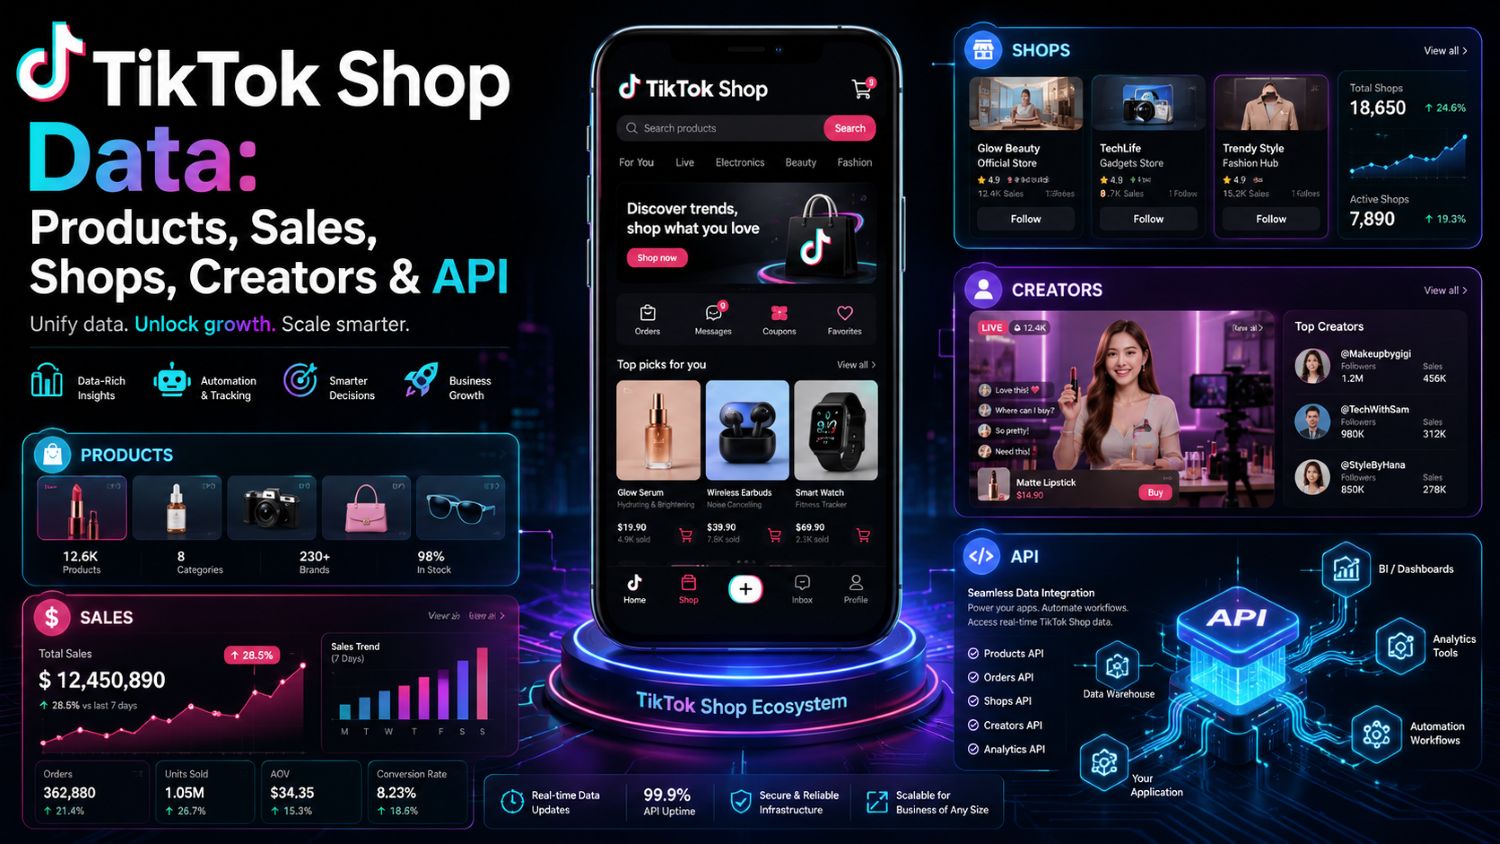
TikTok Shop data includes product sales, estimated GMV, shop performance, creator activity, shoppable videos, live streams, prices, reviews, and category trends.
TikTok Seller Center shows what happened inside your own shop. A third-party platform such as EchoTik helps you study the wider market.
That includes products you do not sell, creators you have not worked with, and competing shops you do not own.
The goal is not to collect more numbers.
The goal is to make better decisions about products, creators, content, competitors, and markets.
Quick Answer
There are two main types of TikTok Shop data.
First-party data comes from your own TikTok Shop account. It includes your orders, GMV, traffic, conversion, refunds, and affiliate results.
Market and competitor data helps you analyze products, shops, creators, videos, live streams, and category movement across TikTok Shop.
You need both.
Your own shop data tells you what happened to your business. Market data helps you understand why it happened and what other sellers are doing.
What Is TikTok Shop Data?
TikTok Shop data is the information created when products, shops, creators, videos, live streams, and buyers interact on TikTok Shop.
Some of this data belongs to your own shop.
Other data comes from public product pages, creator activity, shop rankings, videos, live streams, and market movement.
Common data fields include:
Product sales
Estimated product GMV
Shop sales and estimated GMV
Product prices
Product rankings
Category rankings
Creator sales performance
Shoppable video activity
Live-room sales
Audience trends
Product reviews
Video views and engagement
Country and regional trends
The value does not come from one field.
It comes from connecting the fields.
A product may have high sales because one creator posted a viral video. Another product may grow through several shops, creators, videos, and live rooms.
Those are two very different opportunities.
First-Party Data vs Market Data
This is the most important distinction to understand.
First-party TikTok Shop data
First-party data comes from your own authorized shop.
You normally access it through TikTok Seller Center, Shop Analytics, affiliate reports, advertising reports, or an authorized API.
It may include:
Your shop GMV
Orders
Units sold
Product impressions
Product page views
Click-through rate
Conversion rate
Refunds
Traffic sources
Affiliate orders
Advertising performance
Customer activity
This data is useful for improving your own operation.
It helps you answer questions such as:
Which product converts best?
Where does my traffic come from?
Which creator generates orders?
Why did refunds increase?
Which product page is losing customers?
It does not give you a complete view of the market.
TikTok Shop market data
Market data helps you understand products, shops, creators, and content outside your own account.
With EchoTik E-commerce Analysis, sellers can research signals such as:
Product estimated GMV
Shop estimated GMV
Sales movement
Product ranking changes
Competing shops
Related creators
Shoppable videos
Category movement
Country-level differences
Live-stream activity
Market data helps you answer different questions:
Which products are gaining demand?
Who is already selling them?
Is one shop controlling the market?
Which creators are driving sales?
Are several videos working?
Is the category still growing?
Is the product already saturated?
A simple way to remember the difference is:
Seller Center tells you what happened inside your shop. EchoTik helps you understand what is happening across the market.
The TikTok Shop Data That Sellers Should Track
You do not need every available metric.
Start with the fields that can change a business decision.
1. Product Sales and Estimated GMV
Product sales tell you whether buyers are spending money.
Estimated GMV shows the value of those sales over a selected period.
Use these fields to compare products in the same market, category, and time range.
Do not compare unrelated products without context.
A high-priced appliance can generate more GMV than a low-priced beauty product while selling fewer units.
What to check
Estimated GMV
Units sold
Daily sales movement
Weekly sales movement
Average selling price
Discount activity
What it helps you decide
This data helps you build a product shortlist.
It does not tell you whether the product is profitable or easy to enter.
2. Product Sales Movement
Total sales show the result.
Sales movement shows the direction.
A product with strong historical sales may already be declining. Another product with lower total GMV may be growing steadily.
Compare several time periods:
Last 24 hours
Last seven days
Previous seven days
Last 30 days
Look for consistent movement.
One large spike may come from a viral video, major creator, flash sale, or successful live stream.
What it helps you decide
Sales movement helps you separate active demand from old success.
It can also help you find a product before the market becomes crowded.
3. Product Ranking Movement
A product moving up a category ranking may be gaining momentum.
A product falling for several periods may be losing demand.
One ranking change is not enough to make a decision.
Check whether the movement is supported by:
More sales
More creators
New shoppable videos
More active shops
Continued live-stream activity
What it helps you decide
Ranking movement helps you decide which products deserve deeper research.
It should not be used as a final product-selection rule.
4. Shop Performance
A product can look attractive until you discover that one large shop controls most of the market.
Study the shops behind the product.
Check:
Shop estimated GMV
Leading products
Product count
Price range
Customer reviews
Creator relationships
Shoppable video activity
Live-stream frequency
Then compare the leading shop with smaller sellers.
If smaller shops are also growing, demand may be easier to reproduce.
If only one established shop can sell the product, the opportunity may depend on brand trust, price, reviews, or exclusive supply.
What it helps you decide
Shop data helps you understand market concentration and competitive difficulty.
5. Creator Performance
Follower count does not tell you whether a creator can sell.
A smaller creator with strong product fit may generate more orders than a large entertainment account.
Useful creator data includes:
Recent product promotions
Estimated sales contribution
Category relevance
Shoppable video performance
Live-selling activity
Posting frequency
Engagement quality
Competitor partnerships
Look for creators who have sold similar products more than once.
One successful video can be luck. Repeated sales are a stronger signal.
What it helps you decide
Creator data helps you build a better outreach list and avoid paying for an audience that does not buy.
6. Shoppable Video Data
Views show attention.
Shoppable video data helps you understand whether the attention moved closer to a purchase.
Check:
Views
Likes
Comments
Shares
Estimated sales
Related product
Creator
Posting date
Video hook
Demonstration style
Do not copy the leading video.
Break it down.
Ask:
What happens in the first three seconds?
Which problem is shown?
How is the product demonstrated?
What proof is offered?
Which objection is answered?
What makes the viewer act?
What it helps you decide
Video data helps you find content angles that can be tested by your own creators.
7. Live-Stream Data
Some products need more explanation than a short video can provide.
This is common with skincare routines, appliances, health products, fashion, and products with several functions.
With EchoTik Live Monitor, sellers can study live-room activity.
Useful live data may include:
Live-room estimated GMV
Products featured
Audience movement
Peak viewers
Traffic changes
Product order
Host selling points
Viewer questions
Sales activity
Try to connect the sales with what happened during the live.
Did orders increase after a demonstration? Did viewers stay when the host explained a specific benefit? Did a discount create a short spike?
What it helps you decide
Live data helps you improve product order, demonstrations, offers, and host scripts.
8. Price and Discount Data
A product with rising sales can still be entering a price war.
Watch how competing shops price the same or similar products.
Check:
Normal selling price
Discounted price
Bundle offers
Shipping incentives
Creator coupons
Price movement over time
Frequent price cuts can be a warning.
If every seller competes through discounts, your margin may disappear quickly.
What it helps you decide
Price data helps you understand whether the opportunity can support a profitable offer.
9. Reviews and Comments
Sales data tells you what people bought.
Reviews and comments explain what customers expected.
Look for repeated feedback about:
Product quality
Size
Instructions
Color
Packaging
Delivery
Results
Missing features
Returns
Customer support
Positive reviews reveal the strongest benefits.
Negative reviews reveal product risk.
What it helps you decide
Customer feedback can help you improve the product page, creator brief, instructions, bundle, and quality-control process.
It can also help you reject a product before it creates refunds.
10. Category and Country Data
A product that works in one country may fail in another.
Customer needs, prices, creator styles, shipping costs, regulations, and category maturity can all change by market.
Always filter data by:
Country
Category
Time range
Price range
Product type
Do not build one global winning-product list.
Research the market where you can actually sell and provide support.
A Real TikTok Shop Data Example
Weekly rankings are useful when they help you understand the structure behind sales.
In the US ranking for July 20–26, 2026, medicube US Store recorded estimated GMV of $12.4 million to $15.2 million.
Beauty was clearly strong, but the product ranking showed a wider market.
The leading products included:
medicube PDRN skincare product: $2.8M–$3.4M
Die-cast car models: $2.3M–$2.9M
Trading-card storage accessory: $1.5M–$1.8M
The data does not only show that beauty was selling.
It also shows demand for products that support collecting, demonstrations, and community content.
That creates a better research question:
Which products have strong sales and several repeatable reasons for creators to talk about them?
The answer may be more useful than simply copying the product with the highest GMV.
Source: EchoTik weekly ranking data, July 20–26, 2026. GMV figures are estimates intended for market comparison and trend analysis.
How to Use TikTok Shop Data for Product Research
Here is a workflow sellers can repeat every week.
Step 1: Choose one market
Select a country and category.
Add a realistic price range based on your customer, supply chain, and operating model.
Step 2: Find products with recent movement
Use EchoTik E-commerce Analysis to find products with current sales activity.
Build a shortlist of 10 to 20 products.
Do not make a decision yet.
Step 3: Compare sales periods
Check whether each product is growing, stable, or falling.
Remove products that depend on one old spike unless there is a clear reason demand may return.
Step 4: Check shop concentration
Find the shops driving the product’s sales.
Ask whether smaller shops can compete or whether one large seller controls the market.
Step 5: Check creator concentration
Find the creators promoting the product.
A product supported by several relevant creators may be easier to scale than one dependent on a single account.
Step 6: Study the videos
Review the videos connected to sales.
Write down at least three content angles your own creators could produce without copying.
Step 7: Check live selling
If the product needs explanation, study related live rooms.
Look for demonstrations, viewer questions, host scripts, traffic changes, and offers.
Step 8: Read reviews
Find repeated complaints.
Reject products with serious quality, safety, shipping, or expectation problems unless you can clearly solve them.
Step 9: Calculate the real margin
Include:
Product cost
Packaging
Shipping
TikTok Shop fees
Creator commission
Samples
Advertising
Discounts
Returns
Customer support
Estimated GMV is not profit.
Step 10: Run a controlled test
Start with limited inventory and a small group of creators.
Set the test budget, success target, and stopping point before launch.
Use your own first-party data to decide whether to stop, improve, or scale.
How to Use TikTok Shop Data for Competitor Research
Competitor research is not about copying a shop.
It is about understanding how the shop creates sales.
Start with these questions:
Which products produce most of its GMV?
Does it depend on one hero product?
Which creators send traffic?
How often does it publish videos?
Does it use live streams?
What prices and bundles does it offer?
Which customer objections does it address?
Is it entering new categories?
Track changes over time.
A competitor launching several related products may be building a category position.
A competitor reducing prices may be protecting market share or clearing inventory.
A sudden increase in creator activity may signal a planned campaign.
Use the data to find gaps, not products to copy.
How to Use TikTok Shop Data for Creator Selection
Start with category fit.
Then check whether the creator has produced sales for similar products.
A practical creator review should include:
Recent sales activity
Product history
Content style
Audience response
Video consistency
Live ability
Competitor overlap
Expected commission
Brand fit
Do not build the list from follower count alone.
A creator should be able to explain the product naturally.
If the promotion feels disconnected from the creator’s normal content, the audience may ignore it.
Dashboard, API or Dataset: Which One Do You Need?
TikTok Shop data can be accessed in several ways.
The right option depends on what you want to do.
TikTok Seller Center
Best for sellers analyzing their own authorized shop.
Use it for orders, traffic, conversions, refunds, and first-party shop performance.
Analytics dashboard
Best for sellers, brands, and agencies that need to research the market without building their own software.
A dashboard is the fastest option for product research, competitor analysis, creator discovery, and weekly reporting.
TikTok Shop API
Best for developers working with authorized shop operations or approved TikTok integrations.
Official APIs are important for managing data connected to shops that have granted access.
Third-party data API
Best for teams that need structured market data across products, shops, creators, videos, and live streams.
The EchoTik Data API is designed for agencies, brands, SaaS products, and data teams that need repeatable access.
Common use cases include:
Internal dashboards
Product research systems
Competitor monitoring
Creator databases
Automated market reports
Live-commerce monitoring
Customer-facing analytics products
Dataset
Best for teams that need a large snapshot or recurring delivery for analysis.
A dataset may be useful for business intelligence, market research, model training, or historical reporting.
Before buying a dataset, confirm:
Countries covered
Fields included
Update frequency
Historical depth
Missing-value handling
Delivery format
Usage rights
Support
How Accurate Is TikTok Shop Data?
First-party shop data and third-party market estimates are not the same.
Your authorized Seller Center data comes directly from your own account.
Third-party platforms may collect public signals and use estimation methods to understand market performance.
Estimated GMV is useful for:
Comparing products
Comparing shops
Measuring market direction
Finding growth signals
Identifying competitors
Prioritizing research
It should not be treated as audited revenue.
A responsible analysis uses ranges, trends, and comparisons rather than claiming that every estimate is exact.
When making a large inventory or investment decision, combine third-party data with:
Your own test results
Supplier information
Actual product costs
Customer reviews
Authorized shop data
Logistics data
Compliance checks
Common TikTok Shop Data Mistakes
Looking only at total GMV
A high total may hide falling sales or heavy dependence on one shop.
Check recent movement and concentration.
Treating views as sales
A video can entertain millions of people without creating many orders.
Check product activity and buying-intent comments.
Ignoring the time range
TikTok Shop moves quickly.
Always confirm whether the data covers today, seven days, 30 days, or a longer historical period.
Comparing different countries directly
Market size and customer behavior vary.
Compare products inside the same country and category first.
Trusting one creator spike
One viral creator can make a weak product look stronger than it is.
Check whether other creators can produce sales.
Forgetting profit
GMV is not profit.
Calculate every major cost before testing.
Collecting data without making a decision
Every research session should end with one action:
Test
Monitor
Reject
Contact creators
Improve the offer
Study the competitor
Stop spending
If the data does not change an action, it is probably not the right metric.
A Simple Weekly TikTok Shop Data Routine
You do not need to watch every dashboard all day.
Use a simple schedule.
Daily
Check:
Product sales movement
Important ranking changes
Creator activity
Live-stream performance
Competitor price changes
Weekly
Review:
Product shortlist
Category movement
Leading shops
Creator results
Content patterns
Product margins
New test opportunities
Monthly
Evaluate:
Market direction
Category concentration
Product portfolio
Creator network
Competitor strategy
Expansion opportunities
Products to stop supporting
A consistent routine is more useful than reacting to every small change.
Practical Takeaways
Use Seller Center to understand your own shop.
Use market data to understand products, creators, shops, and competitors.
Compare trends instead of relying on one GMV number.
Check whether sales depend on one shop or creator.
Study the videos and live rooms behind product movement.
Use reviews to find customer objections and return risks.
Research each country separately.
Treat third-party GMV as an estimate.
Calculate profit before testing.
Start small and let first-party results guide scaling.
TikTok Shop data is useful when it turns uncertainty into a clear next step.
FAQ
What is TikTok Shop data?
TikTok Shop data includes information about products, sales, GMV, orders, shops, creators, videos, live streams, prices, reviews, traffic, and market trends.
Some data comes from your own authorized shop. Other data is used to understand the wider TikTok Shop market.
Where can I find TikTok Shop sales data?
You can find your own sales data in TikTok Seller Center.
For product, competitor, creator, category, and market research, you can use a third-party TikTok Shop analytics platform such as EchoTik.
Can I see competitor TikTok Shop data?
You cannot access a competitor’s private Seller Center information.
Third-party analytics platforms can provide market estimates and public signals, including estimated GMV, product movement, related creators, videos, and shop rankings.
Is TikTok Shop GMV data accurate?
Authorized first-party GMV comes from your own shop account.
Third-party GMV should be treated as an estimate. It is useful for comparison and trend analysis, not audited financial reporting.
What TikTok Shop data should product researchers track?
Start with estimated GMV, sales movement, shop concentration, creator activity, video performance, live activity, pricing, reviews, and margin.
Do not choose products from views or total sales alone.
Does TikTok Shop have an API?
TikTok provides APIs for approved developers and authorized shop workflows.
Third-party APIs can also provide structured market data for product research, competitor monitoring, creator analysis, and market intelligence.
Can I export TikTok Shop data?
TikTok Seller Center provides exports for certain first-party reports.
Third-party dashboards and APIs may also support exports or structured data access. Available formats depend on the platform and plan.
How often should TikTok Shop data be checked?
Active sellers should review important sales and competitor signals daily or weekly.
Broader category, product portfolio, and market decisions can be reviewed monthly.
Can TikTok Shop data identify a guaranteed winning product?
No.
Data helps reduce risk and reject weak ideas. Product quality, margin, logistics, content, creator fit, reviews, and execution still determine the result.
What does EchoTik provide?
EchoTik helps users research TikTok Shop products, shops, creators, shoppable videos, live streams, rankings, and market trends.
It also provides API access for teams that need structured TikTok commerce data.
Final Thoughts
More data does not automatically create a better TikTok Shop business.
The useful data is the data that changes your next move.
Start with the product. Check the shops behind it. Find the creators and content driving sales. Study the customer response. Then calculate whether the opportunity can make money.
Use EchoTik to analyze TikTok Shop products, competitors, creators, videos, and live rooms before deciding what to test or scale.