How to Track TikTok Shop Competitor Prices and Promotions

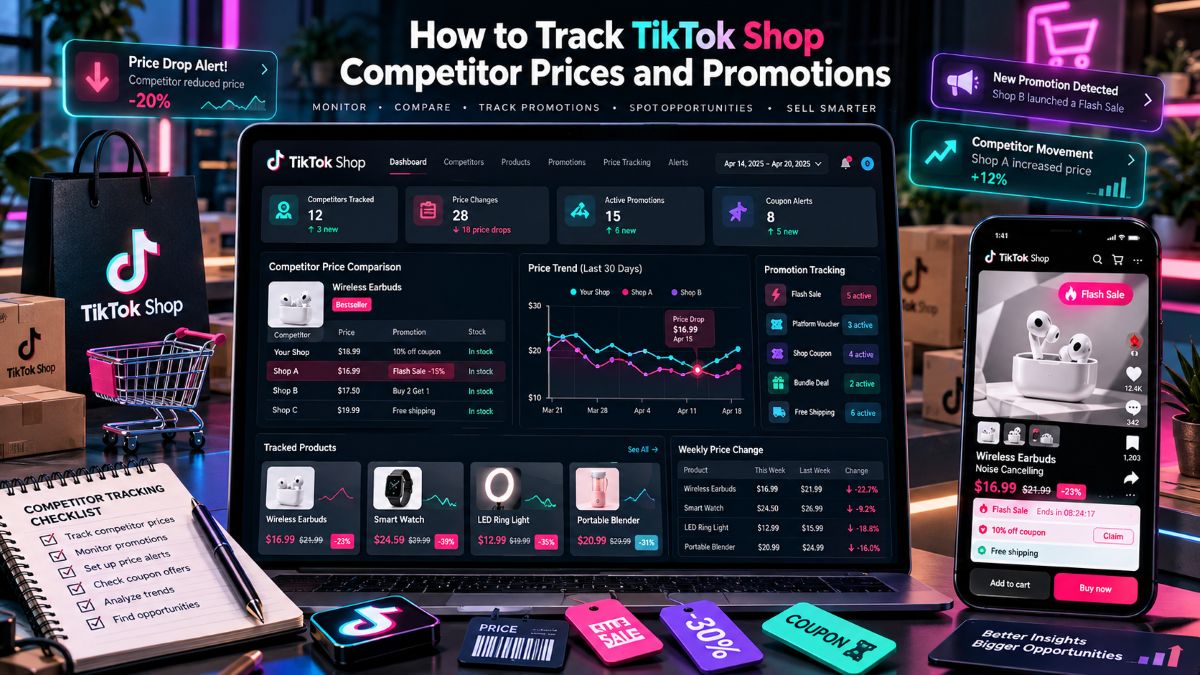
A competitor dropping their price does not always mean you should drop yours.
They may be clearing old inventory. They may be using a platform-funded offer. They may have a lower product cost than you do. Or the product may not be selling well at all, even with the discount.
That is why a TikTok Shop price tracker should do more than show today’s price. You need to see what changed, when it changed, and whether sales actually moved afterward.
For each product you monitor, keep track of the list price, buyer price, coupon, bundle size, shipping offer, recent sales, creator activity, and selling videos. One price on one day rarely tells the whole story.
A Price Tag Does Not Show the Full Offer
TikTok Shop buyers do not always pay the price shown at the top of a listing.
A seller may use a crossed-out list price, a shop coupon, free shipping, a LIVE-only discount, a creator code, or a bundle that changes the actual price per item. Two products can both say “$29.99” and still be very different offers.
One may be a single item with paid shipping. The other may be a two-pack with a coupon and free delivery.
If you only record the public list price, you can end up reacting to a competitor that is not actually cheaper.
The useful number is what the buyer pays after the offer is applied.
You also need to know whether that offer lasts. A one-day deal is different from a lower everyday price. Sellers often panic when they see a temporary promotion and cut their own price for no good reason.
Pick a Few Competitors That Matter
You do not need to watch every shop in the category.
Start with three direct competitors selling a product close to yours. Add a couple of larger stores that set the tone for pricing in the category. Then include one or two newer shops that are growing fast.
That gives you a better mix than simply copying the biggest seller.
Keep the comparison fair. Products should be in the same country, serve the same use case, and have roughly similar specifications. A 12-piece bundle should not be compared against a single-item listing without doing the math.
It also helps to watch one or two substitute products. A buyer may not choose between two identical water bottles, for example. They may choose between a standard bottle and a bottle with a built-in filter. The second product can affect demand even if it is not a direct match.
The point is to understand the choices your customer sees, not to create a massive competitor list.
Build a Price History Instead of Taking Random Screenshots
A simple spreadsheet is enough to begin.
Pick the same day each week. Record the product, shop, listed price, actual buyer price, bundle details, shipping offer, and any visible promotion. Then add sales movement, estimated GMV, and signs of new creator activity.
Here is a basic example:
Date | Product | Shop | List price | Buyer price | Offer | Shipping | Estimated units sold | Estimated GMV |
|---|---|---|---|---|---|---|---|---|
Week 1 | Product A | Shop A | $39.99 | $29.99 | 25% discount | Free | 1,200 | $35,988 |
Week 2 | Product A | Shop A | $39.99 | $34.99 | 12.5% discount | Free | 950 | $33,241 |
Week 3 | Product A | Shop A | $39.99 | $39.99 | No visible offer | Free | 690 | $27,593 |
The example does not prove that the lower price caused more sales. It only gives you a pattern worth investigating.
Third-party sales and GMV figures should also be treated as estimates, not a competitor’s confirmed financial reporting. They are useful for comparing movement in the market. They should not be presented as exact revenue.
Use TikTok Shop data to compare prices, product movement, shops, creators, and related content within the same market and time frame.
Price Changes Need Context
A product can sell more after a price cut for several reasons.
The lower price may have helped. But a creator could have posted a strong video that week. A shop may have gone LIVE. The listing may have picked up new reviews. The product may simply be more relevant because of the season.
Before deciding a competitor’s price change worked, compare the period before, during, and after the promotion.
Look at sales. Look at GMV. Then check whether more creators joined, more shoppable videos appeared, or LIVE activity increased at the same time.
This is where price tracking becomes more useful than simply seeing who is cheapest.
Price movement | Sales movement | What to check next |
|---|---|---|
Price drops and sales rise sharply | Price may have been a real barrier | Check whether sales hold after the offer ends |
Price drops but sales stay flat | Price may not be the main problem | Review content, reviews, product fit, and traffic |
Price rises but sales remain steady | The product may have pricing power | Check whether the offer, brand, or content supports it |
Price stays stable but sales jump | Something else likely changed | Look at creators, videos, LIVE activity, or seasonal demand |
Do not expect clean answers every time. Real marketplaces are messy. The value comes from seeing the same product over several weeks instead of reacting to one change.
Work Out the Real Discount
A bundle can make a product look more expensive than it really is. It can also make a weak deal look better than it is.
Use the actual buyer payment, not the headline discount.
Effective discount =
(List price − actual buyer payment) ÷ list price × 100
If the product is sold as a bundle, also work out the price per unit:
Price per unit =
Actual buyer payment ÷ number of items in the bundle
For example, a $24 single product may appear cheaper than a $40 two-pack. But the two-pack costs $20 per unit. That changes the comparison.
This matters most in categories where sellers use “buy two, get one,” starter kits, refill packs, or gift sets. During promotion periods, bundles often compete better than direct price cuts because they give buyers a reason to act without forcing the shop to lower the base price.
Decide Whether a Competitor’s Discount Is Worth Matching
The answer is often no.
Matching a competitor can make sense if your products are genuinely comparable, price is clearly holding buyers back, and the lower price still leaves enough room for you to make money.
Before changing anything, check your own numbers:
Product and packaging cost
Shipping and fulfillment cost
Platform charges
Creator commission
Paid traffic or promotion cost
Expected refund and return cost
Minimum profit you need from each order
If the lower price leaves you with almost no margin, it is not really a competitive strategy. It is a short-term sales number that may create a bigger problem later.
There are other ways to make an offer stronger.
You could add a useful accessory, create a starter bundle, use a limited-time coupon, offer free shipping above a certain order value, or give creators a better product story to work with.
Sometimes the problem is not the price. Buyers may not understand the product well enough to see why it costs more.
A stronger demo, clearer product images, better reviews, or faster delivery can justify a higher price when a discount cannot.
Watch Promotions Before They Train Buyers to Wait
Promotions can help during product launches, seasonal campaigns, and slow periods. They can also make buyers reluctant to purchase at full price if they happen too often.
That is why price history matters.
If a shop runs the same 30% coupon every week, the discounted price is probably its real market price. The list price is less important.
If another seller only uses a discount during a weekend LIVE or major campaign, that is a different strategy. You do not need to treat it as a permanent price change.
Track the promotion itself, not just the number.
Was it tied to free shipping? Did the seller use a creator code? Was it a bundle? Did it only appear during LIVE? Did the product still sell after the offer disappeared?
That gives you a much clearer picture of what shoppers are responding to.
Use Tools to Make the Routine Easier
A manual spreadsheet works for a small group of products. It is often the best way to learn a category because you see the movement yourself.
Once you are monitoring several competitors, products, and markets, manual updates become time-consuming. A price-tracking or market-research platform can help you organize price history, estimated sales movement, shop activity, creator coverage, and product trends in one place.
When comparing a platform, look for practical features rather than a long feature list. You want the right market coverage, historical data, product matching, country filters, price-change visibility, exports, and clear update timing.
For a wider comparison of competitor, market, product, and reporting platforms, see our guide to the best TikTok analytics tools.
Keep the Weekly Review Simple
Check the same group of products on the same day every week.
First, make sure the product itself did not change. Sellers may adjust quantity, size, color options, or bundles without making that obvious in the headline price.
Then record the buyer price, discounts, shipping, and promotion type. Review sales movement beside those changes. Finally, check whether new creators, videos, or LIVE sessions appeared.
At the end of the review, make one decision for each product:
Keep your current price.
Test a stronger offer without changing the core price.
Test a limited discount.
Stop treating that competitor’s move as relevant.
You do not need to change your own offer every week. In fact, changing too often makes it difficult to learn what is working.
A price tracker is most useful when it helps you avoid bad reactions. It shows whether a competitor’s discount is a real market shift, a short promotion, or just noise that does not deserve your margin.