TikTok Shop Weekly Ranking: Top Stores, Products, Videos and Hashtags

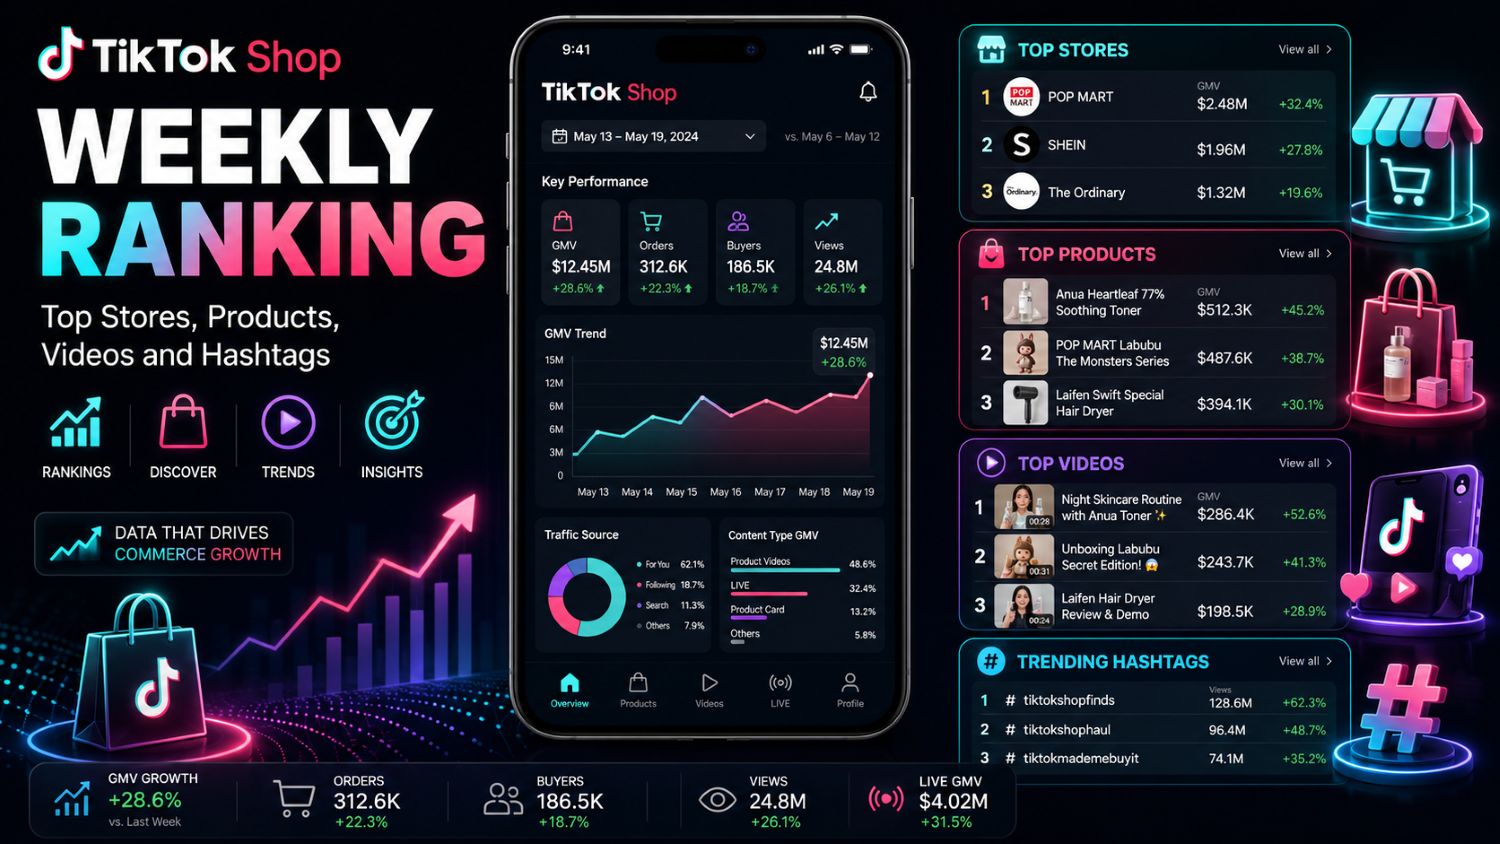
TikTok Shop weekly rankings are not just lists.
For sellers, they are early market signals.
They show which countries are moving, which categories are heating up, which stores are winning, which products are converting, and which videos are actually selling.
Based on EchoTik data for June 22-28, 2026, this week’s ranking covers major TikTok Shop markets including the United States, Indonesia, Malaysia, Thailand, the United Kingdom and Mexico.
The data includes top stores, trending products, selling videos, popular videos and hashtag rankings.
If you are doing TikTok product research, creator discovery, competitor store analysis or live commerce planning, this weekly ranking can help you decide where to look next.
You can use EchoTik to go deeper into product trends, creator data, shop performance, selling videos and market signals.
Executive Summary
This week’s TikTok Shop data shows three clear signals.
Beauty & Personal Care remains the strongest global category.
Seasonal products are gaining momentum in summer markets.
Local-language content is becoming more important than generic viral content.
The United States, Indonesia, Malaysia, Thailand and the United Kingdom all showed strong Beauty & Personal Care activity.
At the same time, summer products such as fans, UV umbrellas, rainwear, cooling devices, sports shorts and car sunshades appeared across several country rankings.
This matters for sellers.
The next winning product may not come from a single viral video. It often appears when store rankings, product rankings, selling videos and hashtags all point in the same direction.
Top Store Rankings: Beauty Still Dominates
The store rankings show that Beauty & Personal Care remains the most stable high-GMV category.
In the United States, medicube US Store ranked first with estimated GMV of $31.3M-$38.2M. Other strong U.S. stores included Comfrt, Laka US, QVC, Ninja Kitchen US, Dr.Melaxin, Shark Home, VEVOR Store, Tarte Cosmetics and iBraStar.
In Indonesia, Glad2Glow.Live ranked first with estimated GMV of $66M-$80.7M. The top list also included Zwitsal, Daily Care by Unilever, glad2glow.indo, SAFF & Co., Maybelline Indonesia and wardahbeautyid.
Malaysia had the most unusual spike. SABYROSEHQ ranked first with estimated GMV of $476.5M-$582.4M. This is not a normal category signal. Sellers should study the product, creator, video and live traffic behind this store before drawing conclusions.
Thailand was led by drpongshop, with estimated GMV of $9.5M-$11.6M in the Health category. Beauty, home essentials and food also appeared frequently.
The United Kingdom showed a different pattern. While medicube UK led the ranking, home appliance stores such as Shark UK, Ninja UK, Redhut Clean Master and Keplin also appeared. That points to strong seasonal home and cooling demand.
Mexico was more fragmented. The top store, TimeOFF-SPORTS, reached estimated GMV of $623.6K-$762.2K. Health, phones, beauty, womenswear and sports all appeared in the ranking.
Trending Products: Do Not Just Look at the Product, Look at the Scenario
The U.S. product ranking was led by medicube PDRN eye patches, with estimated GMV of $14.9M-$18.2M. Comfrt hoodies, Laka lip products, medicube skincare, car models, eye gel, car washing tools and compact cameras also appeared.
This shows two strong U.S. directions this week:
Beauty with clear functional claims.
Comfort, lifestyle and practical home/auto products.
Indonesia was led by Glad2Glow volcanic clay mask, with estimated GMV of $66M-$80.7M. Baby care, fragrance, daily care samples, oral care and deodorant products also ranked.
This suggests that Indonesia is not only a beauty market. It is also strong in daily-use products, baby care and bundle-based promotions.
Malaysia’s product ranking was dominated by HERLEN LIP VINYL X SABYROSE, with estimated GMV of $476.4M-$582.3M. The list also included iPad mini, hair essence, bubble wrap, skincare kits and portable fans.
Thailand showed a clear seasonal signal. UV umbrellas ranked first with estimated GMV of $4.9M-$6M. Raincoats, sunscreen umbrellas, skincare sets, food, toys and flooring products also appeared.
The UK ranking was driven by summer cooling products. LED fan lights, desktop fans, baby grooming tools, portable cooling fans, medicube skincare, Shark outdoor misting fans and cooling LED masks all appeared.
Mexico had a different profile. Sports shorts, casual pants, Infinix phones, vitamins, portable fans, foldable umbrellas and travel pillows appeared. This points to summer, fitness, mobile electronics and outdoor needs.
Selling Video Rankings: The Real Value Is the Script
Product rankings show what sold.
Selling video rankings show why it sold.
In the U.S., top selling videos covered hair growth, cleaning tools, anti-aging skincare, teeth whitening, digestive enzymes, car washing tools, Tarte cosmetics and stress-related health content. The top videos generated sales from 3.23K to 8.35K.
The strongest pattern was simple:
Start with a clear pain.
Show a product.
Make the result easy to understand.
Indonesia’s selling videos were more local and lifestyle-driven. Food seasoning, children’s vitamins, baby products, Glad2Glow skincare and everyday household products performed well. The top selling video reached 18.63K sales.
Malaysia showed strong signals around restocks, affordable pricing, lipstick swatches, food, home scenes and local shopping language. Sellers entering Malaysia should not rely on polished brand videos only. Local creator-style content matters.
Thailand’s selling videos leaned into beauty, cleaning, food, flooring, women’s fashion and home products. Local language and daily-life use cases were much more important than generic product descriptions.
If you want to turn these videos into your own content system, use EchoTik AI Tools to extract scripts, generate product video ideas, rewrite selling points and create TikTok titles.
Popular Video Rankings: High Views Do Not Always Mean High Sales
Popular videos are useful, but sellers must read them carefully.
A high-view video is not always a high-converting video.
In the U.S., the top popular video reached 126.93M views. Other high-view videos included summer promotions, Starbucks content, FIFA World Cup topics, Burberry-related videos, Target discounts and general entertainment clips.
In Indonesia, high-view content included gaming, music, Dove hair serum, toilet cleaning tools, chicken food content, ASUS laptop content and football-related campaigns.
In Malaysia, videos around face masks, entertainment, local food, KFC, Shopee and creator-driven lifestyle content performed strongly.
The UK popular video ranking included Burberry, ceiling fans, football-related content, Deliveroo, Jenna Ortega, Nando’s and FIFA World Cup themes.
Mexico showed strong local culture and sports signals, including Sabritas, football, Spider-Man, Corona, Tostitos and Prime Day.
For sellers, the lesson is clear.
Use popular videos to understand attention.
Use selling videos to understand conversion.
Use product rankings to understand demand.
Do not confuse the three.
Hashtag Rankings: Hashtags Reveal the Traffic Context
Hashtags are not just tags.
They show the language of the market.
In the United States, dealsforyoudays ranked first with 468.32M views from 94.19K videos. Other important hashtags included fyp, ad, tiktokshopcreatorpicks, tiktokshop, viral, summerwins, summer vibes and comedy.
This points to a strong commercial context: deals, creator picks, TikTok Shop and summer promotions.
In Indonesia, fyp led with 195.21M views. Gaming-related tags such as mlbb, mobilelegendsbangbang, hok and honorofkings were also strong.
In Malaysia, fyp reached 51.9M views. Tags around health symptoms, TikTok Shop and local viral language also appeared.
Thailand’s top hashtags included local review language, fyp, product recommendation phrases, Free Fire and local shopping terms.
In the UK, tiktokmademebuyit led with 52.51M views. ad, summersale, fyp, skincare, burberry and dealdrops were also important.
Mexico was led by publicidad, with 140.54M views. Other strong hashtags included football-related campaign tags, fyp, tiktokshop, parati, viral, spiderman and entertainment topics.
For sellers, hashtags should not be copied blindly. They should be used to understand the content environment.
What Sellers Should Do This Week
If you sell beauty products, study the U.S., Indonesia, Malaysia, Thailand and UK markets.
Do not only copy medicube, Glad2Glow or SABYROSE. Look at product ingredients, bundles, creator videos, comments, pricing and live-room patterns.
If you sell home appliances, study the UK and U.S. markets.
Fans, cleaning tools, air-cooling products, kitchen appliances and home improvement products are showing seasonal demand.
If you sell summer products, watch Thailand, Mexico and the UK.
UV umbrellas, raincoats, portable fans, sportswear and travel-friendly products are becoming more visible.
If you are a cross-border seller, localize your content.
The same product cannot use the same script in every market. Indonesia needs lifestyle language. Thailand needs local usage scenes. Mexico needs cultural and football-related context. The UK responds strongly to summer and TikTok-made-me-buy-it framing.
How to Use EchoTik for Weekly Market Research
Here is the workflow I would use every week.
First, check the country store rankings.
This tells you who is making money.
Second, check product rankings.
This tells you what is converting.
Third, check selling video rankings.
This tells you how products are being sold.
Fourth, check popular video rankings.
This tells you where attention is moving.
Fifth, check hashtag rankings.
This tells you which traffic language is active.
Then connect the signals.
If the same category appears in store rankings, product rankings and selling video rankings, it deserves deeper research.
Use EchoTik E-commerce Analysis to track product categories, shops, creators and videos. Use EchoTik Live Monitor to monitor live-room traffic, product lists, sales pitch and GMV signals. Use EchoTik Data API if your team needs weekly dashboards.
Final Takeaway
The 2026 Week 26 TikTok Shop ranking shows a clear market pattern.
Beauty remains the global base category.
Summer products are gaining momentum.
Local content is becoming more important.
Selling videos matter more than viral videos for ecommerce decisions.
Weekly rankings are not the final answer.
They are the starting point.
Use EchoTik to connect store data, product data, creator videos, hashtags and live-commerce signals. That is how sellers find the next product opportunity before it becomes obvious.
Data source: EchoTik TikTok Shop Weekly Ranking, June 22-28, 2026.