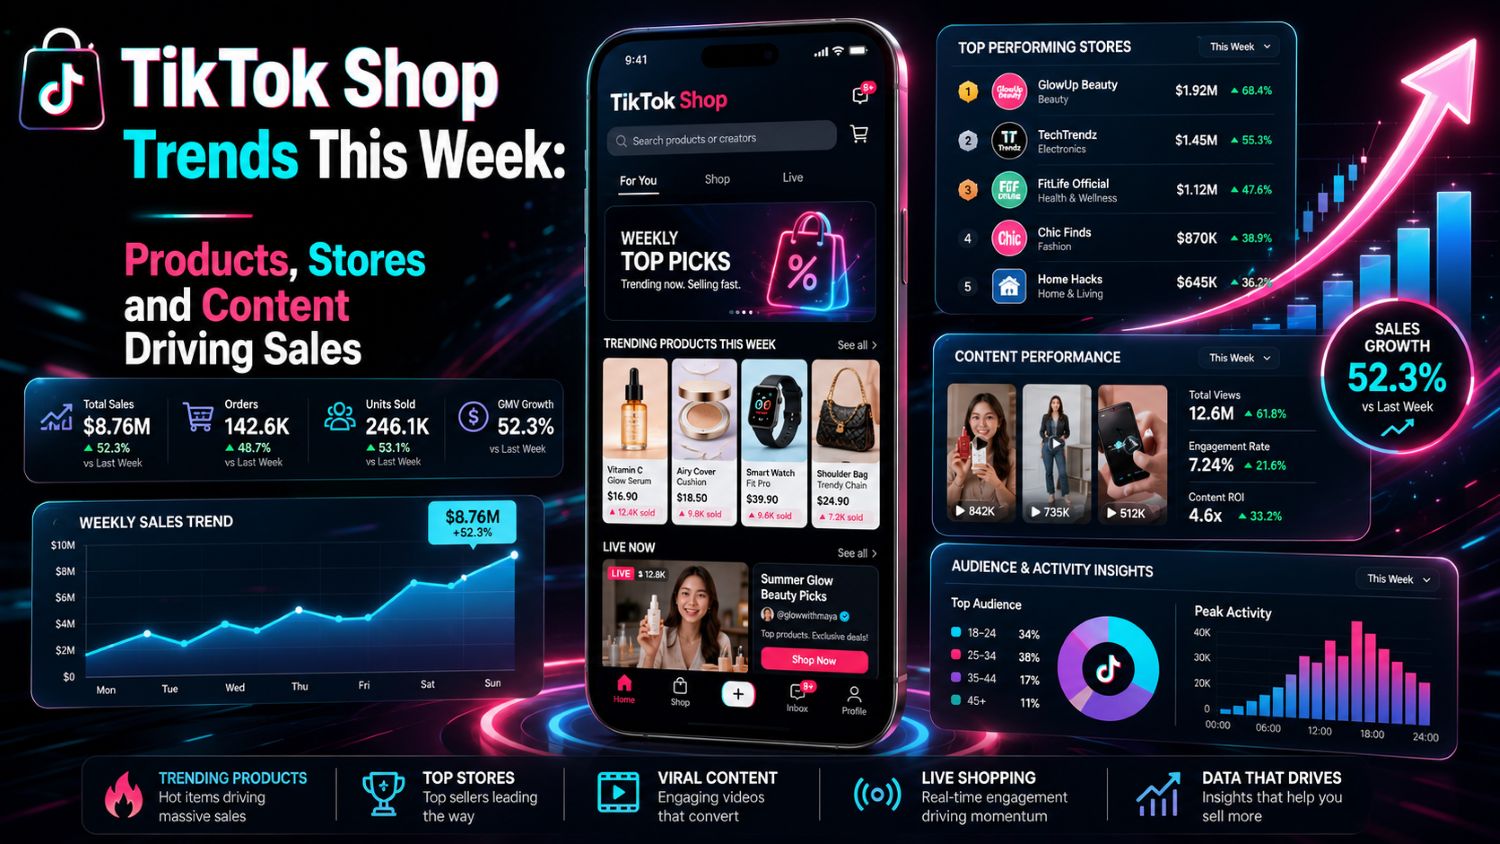
TikTok Shop Trends This Week: Products, Stores and Content Driving Sales

The biggest shop is not always selling the best product for you to test.
It may have a large creator network, years of customer reviews, or a budget that a smaller seller cannot match.
Weekly data is more useful when you read it in layers. Start with the leading stores, then check the products, videos, creators, and content behind the sales.
This analysis uses EchoTik rankings from the US, Indonesia, Malaysia, Thailand, the UK, Mexico, and Spain for July 20–26, 2026.
Source: EchoTik weekly ranking data, July 20–26, 2026. GMV figures are estimates and should be used for market comparison rather than audited revenue reporting.
Quick Answer
Beauty and personal care remained strong across most of the markets reviewed.
However, the data also shows clear local differences.
Indonesia had strong demand for baby products. Malaysia was heavily led by beauty. Thailand showed demand for health, food, and personal care. The UK and Spain had more visible home-appliance products.
The US market was more mixed. Beauty led the shop ranking, but collectibles, footwear, clothing, home products, and tools also appeared in the top 10.
The main lesson is simple: do not take a winning product from one country and assume it will work everywhere.
What This Data Can Tell Sellers
A weekly ranking cannot tell you whether a product will remain popular next month.
It can help you see:
Which categories currently attract spending
Which shops control large parts of a category
Which products are producing sales now
Which content formats are moving products
Which countries have different customer priorities
Where a product may already be difficult to enter
The data is a starting point.
Before testing a product, you still need to check margin, competition, creator availability, reviews, logistics, and policy risk.
Weekly Market Snapshot
Market | Leading shop or product signal | Estimated weekly GMV |
|---|---|---|
United States | medicube US Store | $12.4M–$15.2M |
Indonesia | Zwitsal | $255.5M–$312.3M |
Malaysia | LuxeFoundationHQ | $240.7M–$294.1M |
Thailand | Top health shop shown in the ranking | $51.8M–$63.3M |
United Kingdom | medicube UK | $2.1M–$2.5M |
Mexico | Tienda Xiaomi México | $752.7K–$920K |
Spain | Ninja Kitchen ES | $163.1K–$199.3K |
These markets should not be compared by GMV alone.
Market size, currency handling, category structure, price, product availability, and platform development can all affect the numbers.
The useful comparison is the category and sales pattern inside each market.
United States: Beauty Leads, but Demand Is Spread Across Categories
medicube US Store led the US shop ranking with an estimated GMV of $12.4 million to $15.2 million.
Dr.Melaxin followed at $4 million to $4.9 million. Laka US also appeared in the top 10.
This puts three beauty and personal-care stores in the weekly top-shop list.
However, the US market was not controlled by one category.
The ranking also included:
QVC, Inc in footwear
Comfrt in womenswear
Mellow Sleep in home textiles
VEVOR Store in home improvement
Crocs in footwear
EcoFlow Technology Inc. in home improvement
Gates Consignment in collectibles
For sellers, this is a better signal than a beauty-only ranking.
It suggests that products with a clear demonstration, recognizable use case, or strong brand identity can still compete across several US categories.
What sold at product level?
The leading US product was a medicube PDRN skincare product with estimated GMV of $2.8 million to $3.4 million.
But the next two products were not beauty products:
Die-cast car models: $2.3M–$2.9M
Trading-card protection and storage accessory: $1.5M–$1.8M
This matters.
Collectibles may not look like an obvious TikTok Shop category, but they have several useful content qualities. Creators can unbox them, compare designs, show collections, and build a community around them.
Other products in the US top 10 included a cordless pressure washer, perfume, body care, a nasal inhaler, and another medicube skincare set.
The US opportunity was not simply “sell skincare.” It was “sell products people can demonstrate, collect, compare, or discuss.”
Indonesia: Baby Care and Beauty Show Strong Buying Demand
Zwitsal led the Indonesian shop ranking with estimated GMV of $255.5 million to $312.3 million.
The leading product was a Zwitsal baby toiletries gift box with estimated GMV of $246.9 million to $301.8 million.
The closeness of those two ranges suggests that this product was a major part of the shop’s weekly result.
For a seller, that is both an opportunity signal and a warning.
The demand is clear. But entering the market with another basic baby set may be difficult if one established brand already controls customer trust.
Other leading Indonesian shops included:
Daily Care by Unilever
Philips Avent Official
Philips Home Appliances
Aku Anak SGM
glad2glow.indo
wardahbeautyid
Philips Personal Care Official
Scarlett Whitening
Baby products and beauty appeared repeatedly.
Home appliances also had a clear position through Philips.
What should sellers do with this information?
Do not copy the number-one gift set.
Study why buyers choose it.
Look at:
Product combination
Gift packaging
Price
Brand trust
Parent-focused creator content
Seasonal demand
Reviews
Repeat-purchase potential
A smaller seller may find more room in an adjacent product than in a direct copy.
Examples might include travel-size baby care, newborn gift accessories, storage products, or products solving a specific parent problem.
Malaysia: Beauty Is the Main Battleground
Malaysia’s store ranking was heavily concentrated in beauty and personal care.
LuxeFoundationHQ led with an estimated GMV of $240.7 million to $294.1 million.
NADEAR BEAULAB HQ and SALYRA SHOP followed with estimated GMV ranges of $98 million to $119.8 million and $92.8 million to $113.4 million.
Six of the top 10 stores shown were in beauty and personal care.
The leading products told the same story:
A makeup set: $235.4M–$287.7M
A lip product: $98M–$119.8M
A beauty supplement or related product: $92.2M–$112.7M
Moisturizing cream: $33.1M–$40.5M
Lip vinyl product: $26.2M–$32M
Brown eye makeup: $23M–$28.2M
This is strong demand, but it also means strong competition.
A new beauty seller should not enter with a generic product and a generic “before and after” video.
The offer needs a clear reason to exist.
That might be:
A specific skin concern
A shade range for a local audience
A better bundle
A lower-risk sample size
A creator with strong category trust
A different application format
Clearer product education
Malaysia also shows the power of food content
Food and beverage products appeared among the leading products and stores.
The top shoppable videos included food-focused content with thousands of recorded sales.
This is a useful reminder: a product does not need a complex explanation if the video can create an immediate sensory reaction.
Taste, texture, preparation, and customer reaction can all become the hook.
Thailand: Health, Personal Care and Food Work Together
Thailand’s leading shop was in the health category, with estimated GMV of $51.8 million to $63.3 million.
Beauty store Hyaclassy Thailand followed at $25.8 million to $31.5 million.
The top 10 also included food, household products, maternal and baby products, and more health and beauty stores.
The product ranking showed the same variety.
Leading products included:
A health product: $51.3M–$62.7M
A personal-care product: $25.8M–$31.5M
Body-care cream: $5M–$6.1M
Skincare ointment: $4.6M–$5.6M
Tomato drink powder: $3.4M–$4.2M
A soft sensory toy basket: $3.4M–$4.2M
Jewelry: $3.1M–$3.7M
Face cream set: $3M–$3.6M
The category mix suggests that Thai TikTok Shop demand is not built only around visual beauty transformations.
Health routines, food, household use, and practical demonstrations also matter.
Health sellers need to be careful with product claims. Strong demand does not remove the need for clear ingredients, compliant language, and realistic customer expectations.
United Kingdom: Beauty and Appliances Lead, but Practical Products Still Win
medicube UK led the UK shop ranking with estimated GMV of $2.1 million to $2.5 million.
plmakeupacademy followed at $1.8 million to $2.2 million.
Shark UK, Dr.melaxin UK, and Ninja UK also appeared near the top.
This puts beauty and home appliances at the center of the UK ranking.
However, the leading product was a baby electric nail trimmer, with estimated GMV of $569,600 to $696,200.
That product has a simple value proposition.
It solves a clear parent concern and can be demonstrated quickly.
Other leading products included:
P.Louise beauty bundles
A folding treadmill
A medicube PDRN product
Women’s health supplements
Work trousers
A modular sofa
Men’s sports shorts
Collagen supplements
The UK data shows that practical products can compete with large beauty brands.
The product needs to solve a recognizable problem and make that solution easy to show.
Mexico: Electronics Lead the Store Ranking
Tienda Xiaomi México ranked first in Mexico with estimated GMV of $752,700 to $920,000.
The next leading shops included health, kitchen, beauty, and womenswear sellers.
At product level, the POCO F8 Pro smartphone led with estimated GMV of $348,500 to $425,900.
Other products included:
Women’s sports sets
Custom T-shirts
Yoga clothing
A support pillow
Health supplements
Folding umbrellas
Insulated tumblers
Digestive supplements
This market showed a wider product mix than Malaysia or Indonesia.
Electronics can produce high GMV because of higher prices. That does not automatically mean they produce better margins.
Sellers should separate revenue from profit.
Warranty, returns, technical support, shipping, and price competition can make electronics harder to operate than a lower-priced lifestyle product.
Spain: Smaller GMV, Clear Appliance Demand
Ninja Kitchen ES led Spain’s shop ranking with estimated GMV of $163,100 to $199,300.
medicube España followed with $102,400 to $125,200.
Shark Home ES and OUKITEL Tech also appeared near the top.
The product ranking included:
medicube exfoliating skincare product: $76.4K–$93.4K
Dual-basket air fryer: $70.9K–$86.7K
Ninja CRISPi air fryer: $45.6K–$55.7K
OUKITEL smartphone: $32.8K–$40.1K
Ice-making machine: $23.1K–$28.3K
Ninja food processor: $22.8K–$27.9K
Philips shaving system: $21.9K–$26.8K
Several leading products are easy to demonstrate.
A creator can show the cooking process, compare results, test a function, or solve a household problem.
That gives sellers many possible content angles.
The difficult part is the operating model. Appliances need reliable shipping, clear warranties, and after-sales support.
What the Shoppable Video Rankings Reveal
A high-view video and a high-selling video are not the same thing.
The US shoppable video ranking was led by a makeup-bag video with 6,170 recorded sales.
The caption was simple: “makeup bag of my dreams.” It showed the use case without a long explanation.
Other leading US videos focused on:
Smoothing clothing
A skincare product explained by a nurse
A rotating car mount
A cordless pressure washer
Magnesium
Beauty application
These videos make the product benefit visible.
Indonesia’s leading shoppable video recorded 18,240 sales and used a direct personal recommendation for a soap product.
Malaysia’s leading video recorded 6,230 sales and used clear promotional language around a food product.
The lesson is not to copy these captions.
The lesson is to notice the structure:
Show the product quickly
Connect it to a familiar problem or desire
Demonstrate the result
Give the viewer a reason to act
A polished advertisement is not always necessary.
The best shoppable content often feels like a recommendation, explanation, demonstration, or reply to a real question.
Do Popular Hashtags Create Sales?
Not by themselves.
In the US weekly hashtag ranking, #fyp generated 335.76 million views. #ad reached 209.1 million, while #tiktokshop reached 135.58 million.
Other commerce-related hashtags included:
#tiktokshopcreatorpicks: 127.87M views#dealsforyoudays: 104.9M views#tiktokmademebuyit: 65.09M views#tiktokshopsummersale: 63.84M views
In the UK, #tiktokmademebuyit reached 44.58 million views.
These are large numbers. They do not prove that adding the hashtag will create sales.
Broad hashtags can help content join a larger conversation. They can also place a product next to thousands of unrelated videos.
A better hashtag mix is:
One broad discovery tag
One commerce tag
One category tag
One product or problem tag
One campaign tag, when relevant
The product demonstration still matters more than the hashtag list.
Views and Sales Must Be Analyzed Separately
The popular-video rankings contained content with tens of millions of views.
In the US, the leading video reached 76.97 million views. Indonesia’s leading popular video reached 32.34 million, and Malaysia’s reached 8.7 million.
Many of these videos were entertainment, sports, technology, promotions, or brand campaigns.
They were not necessarily the leading sales videos.
This is one of the most important points in the data.
A seller should not use views as a substitute for purchase intent.
A video with fewer views may be more valuable if it:
Reaches the right customer
Explains the product clearly
Answers a buying objection
Produces product clicks
Generates orders
Can be repeated by other creators
The goal is not to create the most-watched video in the country.
The goal is to create content that helps the right viewer make a buying decision.
How Sellers Should Use This Weekly Data
Step 1: Choose one country
Do not mix the US, Indonesia, Malaysia, and Europe into one product list.
Start with the market where you can actually sell, ship, and provide support.
Step 2: Find the leading categories
Use the shop ranking to see where customer spending is concentrated.
Then decide whether you want to enter the leading category or explore an adjacent category with less competition.
Step 3: Move from shops to products
A leading shop may depend on one main product.
Compare the shop’s GMV range with its leading products. This helps you see whether the shop is diversified or dependent on a hero product.
Step 4: Check product concentration
Find out whether sales come from one shop, one creator, or many participants.
Demand supported by several shops and creators may be easier to reproduce.
Step 5: Study the selling content
Open the related shoppable videos.
Look for repeated hooks, demonstrations, questions, objections, bundles, and offers.
Step 6: Check the economics
Calculate product cost, shipping, creator commission, discounts, platform fees, returns, and customer support.
High GMV does not guarantee a good margin.
Step 7: Run a controlled test
Start with limited inventory and a small creator group.
Set a test budget, success target, and stopping point before the campaign begins.
EchoTik Data You Can Use
With EchoTik E-commerce Analysis, sellers can move beyond a simple weekly ranking.
Useful research fields include:
Shop estimated GMV
Product estimated GMV
Product ranking movement
Category
Country or region
Competing shops
Related creators
Shoppable video sales
Video engagement
Live-room sales and audience trends
Products that rely on demonstrations should also be checked through EchoTik Live Monitor.
A live room can show when viewers arrived, which products were presented, what the host said, and where sales activity changed.
This helps sellers understand how the product was sold—not just how much it sold.
Practical Takeaways
Beauty remained strong across most of the reviewed markets.
Baby care was a major signal in Indonesia.
Malaysian rankings were heavily concentrated in beauty.
Thailand showed demand across health, beauty, food, and household products.
UK and Spanish rankings gave home appliances a visible position.
Mexico’s leading shop and product were in electronics.
US demand was spread across beauty, collectibles, clothing, footwear, and home products.
High views did not always match high shoppable-video sales.
Broad hashtags created reach but did not prove conversion.
Each market needs its own product, creator, price, and content strategy.
FAQ
What were the leading TikTok Shop categories this week?
Beauty and personal care appeared frequently across the US, Indonesia, Malaysia, Thailand, and the UK.
Baby products were especially visible in Indonesia. Appliances appeared strongly in the UK and Spain, while electronics led Mexico’s shop ranking.
What was the leading US TikTok Shop?
medicube US Store led the supplied US ranking with estimated GMV of $12.4 million to $15.2 million.
This is an estimate from the weekly EchoTik ranking, not audited shop revenue.
What was the leading US TikTok Shop product?
A medicube PDRN skincare product led the supplied US product ranking with estimated GMV of $2.8 million to $3.4 million.
Die-cast car models and trading-card storage accessories followed.
Does a popular hashtag help a TikTok Shop product sell?
A hashtag can support discovery, but it does not create demand by itself.
Product relevance, the opening hook, demonstration, creator trust, offer, and customer intent matter more.
Should sellers copy products from the weekly ranking?
No.
Use the ranking to identify demand. Then check competition, margin, creator concentration, reviews, logistics, and policy risk before testing.
Are EchoTik GMV figures exact?
The figures should be treated as estimated GMV ranges.
They are useful for comparing products, shops, and market direction. They should not be used as audited financial statements.
Final Thoughts
Weekly rankings are useful when they help you ask better questions.
Why did this shop win? Which product created the result? Who promoted it? What did the video show? Can another seller repeat the same process profitably?
That is the difference between chasing a ranking and doing real product research.
Use EchoTik to compare products, shops, creators, videos, and live rooms before choosing what to test next.