Echotik - The Best Tool for TikTok Shop Analytics & Insights

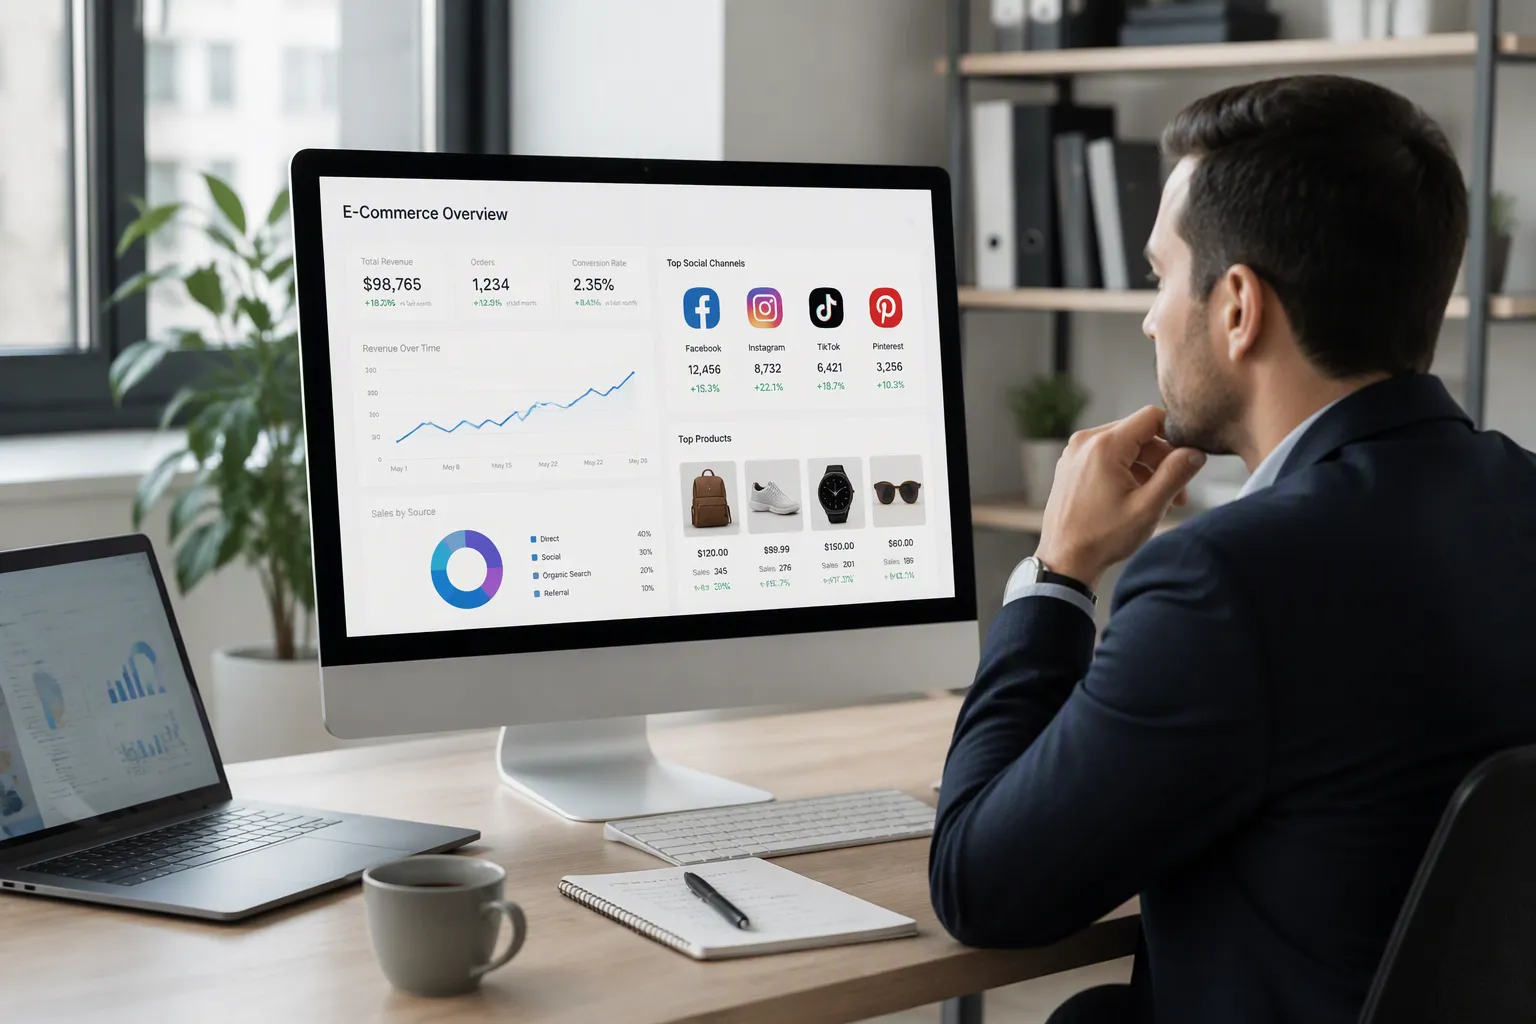
EchoTik is a TikTok Shop data analytics platform. It helps sellers, creators, and brands research products, analyze competitors, and monitor live streams. The extension overlays data directly on TikTok pages, so you see insights without leaving the app.
This post answers three questions. First, what EchoTik is. Second, what features it offers. Third, why it stands out as echotik - the best tool for tiktok shop analytics & insights. You get a direct definition, a feature walkthrough, and a clear case for the platform. Each section builds on the last, so you can follow the logic from setup to payoff.
Key Takeaways
You can track product trends, competitor shops, and live streams in one dashboard.
EchoTik offers a free plan and affordable pricing starting at about $9.90 per month.
Profit tracking reveals hidden fees and alerts you when margins change.
Use EchoTik to make faster decisions and find winning products before they peak.
What Is EchoTik
A Clear Definition
EchoTik is a TikTok Shop data analytics platform. The extension overlays data directly on TikTok pages, so you read product and shop metrics without switching tabs. You install it once, and it works inside the TikTok interface you already use every day.
Think of it as an e-commerce analytics platform built for one marketplace. It pulls product, creator, and shop data into a single view. You then compare listings, spot rising items, and check how a shop performs over time. The overlay keeps every number one click away from the page that produced it. No exports, no spreadsheets, no second dashboard. A quick scan shows which categories move fastest and which listings stall.
Core Purpose and Users
The platform exists to remove manual guesswork. Manual product research stops scaling once you evaluate several ideas per week. Scrolling listings, reviews, and creator content by hand for each competitor eats hours. EchoTik automates that collection, so you discover trends, identify top products, and analyze competitor strategies faster. The analytics update as new videos and shops appear.
The tool also targets a real bottleneck. Tracking 50+ competitor-creator relationships across several rivals is effectively a full-time job. That problem grows when you scale from 10 to 500 creators. EchoTik maps those relationships for you, and that focus is a large part of why echotik - the best tool for tiktok shop analytics & insights earns repeat use.
Seller Center remains the primary source for native Shop orders, buyers, refunds, and product performance.
EchoTik complements that native data rather than replacing it. TikTok Shop sellers, influencers, agencies, brands, and small businesses all use it. New sellers test ideas on a free plan. Agencies monitor multiple brands. Small brands watch live streams and competitor shops in one place. Each group gets the same core benefit: faster decisions from cleaner data. You spend less time collecting numbers and more time acting on them.
Key Analytics Features
Product and Sales Tracking
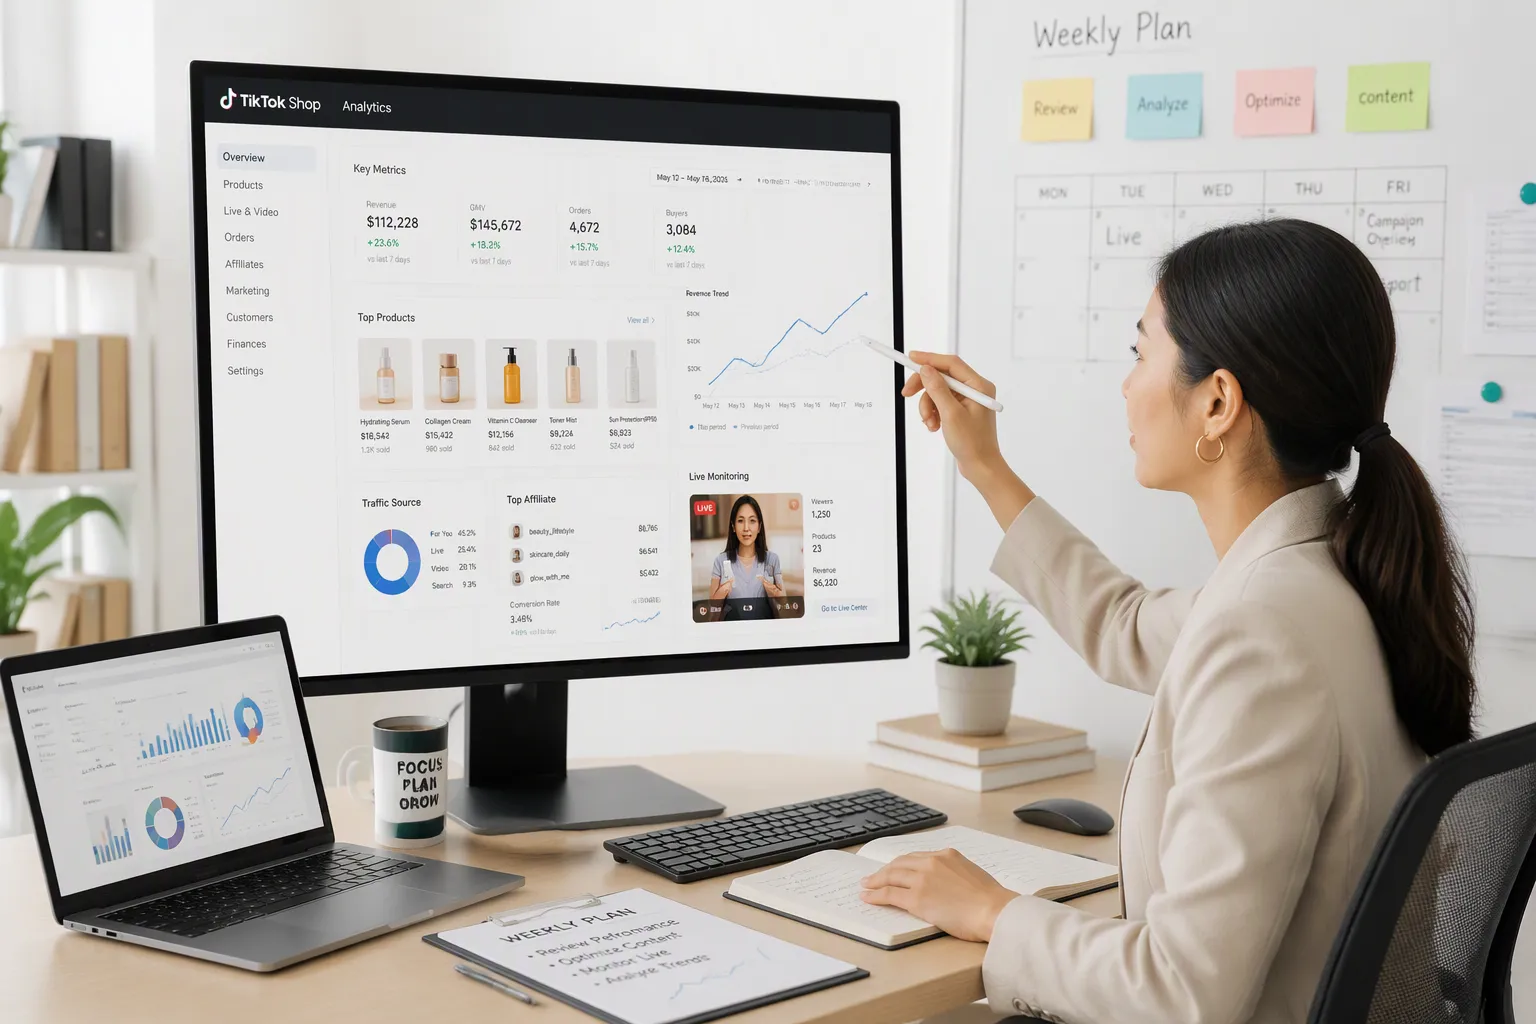
EchoTik packs a complete product research and analytics workflow into one dashboard. The Product Finder surfaces trending products and best sellers. You filter by revenue, sales velocity, category, country, and growth rate using real TikTok Shop data. A viral product tracking view flags items with early momentum. The trending short video product tracker links video performance to actual orders. An ai smart product recommendation engine suggests items worth testing next, and ai recommendations sharpen as more shops enter the dataset. Creator Insights adds real GMV data, engagement rates, and commission history for top performers. Shop Analysis estimates revenue and long-term growth signals for any shop. Category Analysis sizes a market and finds white-space opportunity. Each view answers one question: what is selling now, and what deserves a test?
Your product research does not stop at discovery. The Sales Tracker follows daily, weekly, and monthly revenue for any TikTok Shop. You see ad spend versus organic split, sales volume, and historical performance curves. Total GMV, items sold, category, and price range sit in one table. Set a filter to 10,000+ and sort by that column, and you get a ranked list of best sellers. Ad Spy browses TikTok and Facebook ads filtered by spend, reach, and conversion score. Competitor Analysis monitors rival shops for launches, pricing changes, and revenue shifts. Profit tracking goes further. It shows earnings after each sale and flags hidden fees. Logistics adjustments, policy violation deductions, chargebacks, and promotion adjustments all cut into margin. That gap between gross sales and take-home pay decides your real margin.
Many sellers model only the ~6% referral fee, but the real cost stack on TikTok Shop can exceed 20% before any unit ships or any ad runs.
Real-Time Live Stream Monitoring
Real-time live stream monitoring turns a broadcast into a feedback loop. You watch live sales data as it arrives: products pushed, viewer counts, engagement spikes, and estimated sales. Live analytics show which segments drive add-to-carts. Real-time live sales figures let a host shift focus to winning items mid-stream. The live intelligence layer tracks watch time, comments per minute, shares, and saves. Strong retention earns broader distribution from the algorithm. Audience demographics help you tailor the next segment. Conversion rate, average order value, and revenue per session matter more than total views. Views signal reach, yet they do not pay the bills. Product interactions reveal which items convert and which stall.
After each broadcast, review average watch time, product click rate, and purchase rate. Many brands find the opening minutes shape engagement for the rest of the stream. Track which segments produce the most add-to-carts, then rebuild your script around them. Patterns beat single numbers. This detailed analytics habit converts monitored data into repeatable sales gains and stronger sales performance.
The Chrome extension overlay ties it together. It displays data directly on TikTok pages, so you read live-stream analytics and product metrics without switching tabs. You keep the TikTok interface you already know and gain an analytics layer on top of it. No exports, no second dashboard. That quick access supports faster decisions during a broadcast and keeps your product research moving.
Turning Data into Insights
Spotting Product Trends
You spot fast-moving products before the peak by watching acceleration, not raw size. EchoTik's viral product tracking flags items with early momentum across hashtags, sounds, and creator clusters. A trend that keeps accelerating for several consecutive hours deserves attention. A strong comment-to-view ratio signals real engagement, and a rising save rate signals purchase intent. When multiple unaffiliated creators post about the same item within hours, the algorithm reads organic demand and often predicts a breakout before the peak.
Score each emerging trend before you invest production time. Rate five criteria from 1 to 5: product fit, audience overlap, purchase intent potential, production speed, and trend velocity.
Criteria | What You're Evaluating |
|---|---|
Product Fit | Can your product appear naturally in this trend? |
Audience Overlap | Does the trend's audience match your buyer demographic? |
Purchase Intent Potential | Does the trend create a moment where someone would buy? |
Production Speed | Can you produce a quality version quickly? |
Trend Velocity | Is the trend accelerating fast enough to act now? |
A top total score means produce immediately. A mid score means produce soon. A lower score means act only with spare bandwidth. Below that, skip it and wait for the next trend. Pair this scoring with ai recommendations and solid product research, and you catch windows most sellers miss.
Analyzing Competitors and Creators
Competitor intelligence starts with estimated sales and gmv side by side. High sales with low gmv points to a cheap product. Lower sales with strong gmv points to a premium item. Compare recent and previous-period sales, ranking movement, and new creator activity to judge momentum rather than size alone. Check average selling price to see whether a shop competes on price or bundles.
Creator partnerships deserve the same scrutiny. Track active creators, videos per creator, engagement, and repeat deals. Watch for concentration risk when one creator drives most attention. Shoppable video performance and live commerce metrics reveal which hooks and hosts convert. Use influencer analytics and creator roi to judge partnerships, and run influencer roi analysis before you renew. Compare three to five shops in the same market and category over identical date ranges. That discipline turns store analytics, live sales data, and competitor store tracking into full competitor store intelligence and market intelligence you can act on.
Why EchoTik Is the Best Tool
Unique Advantages
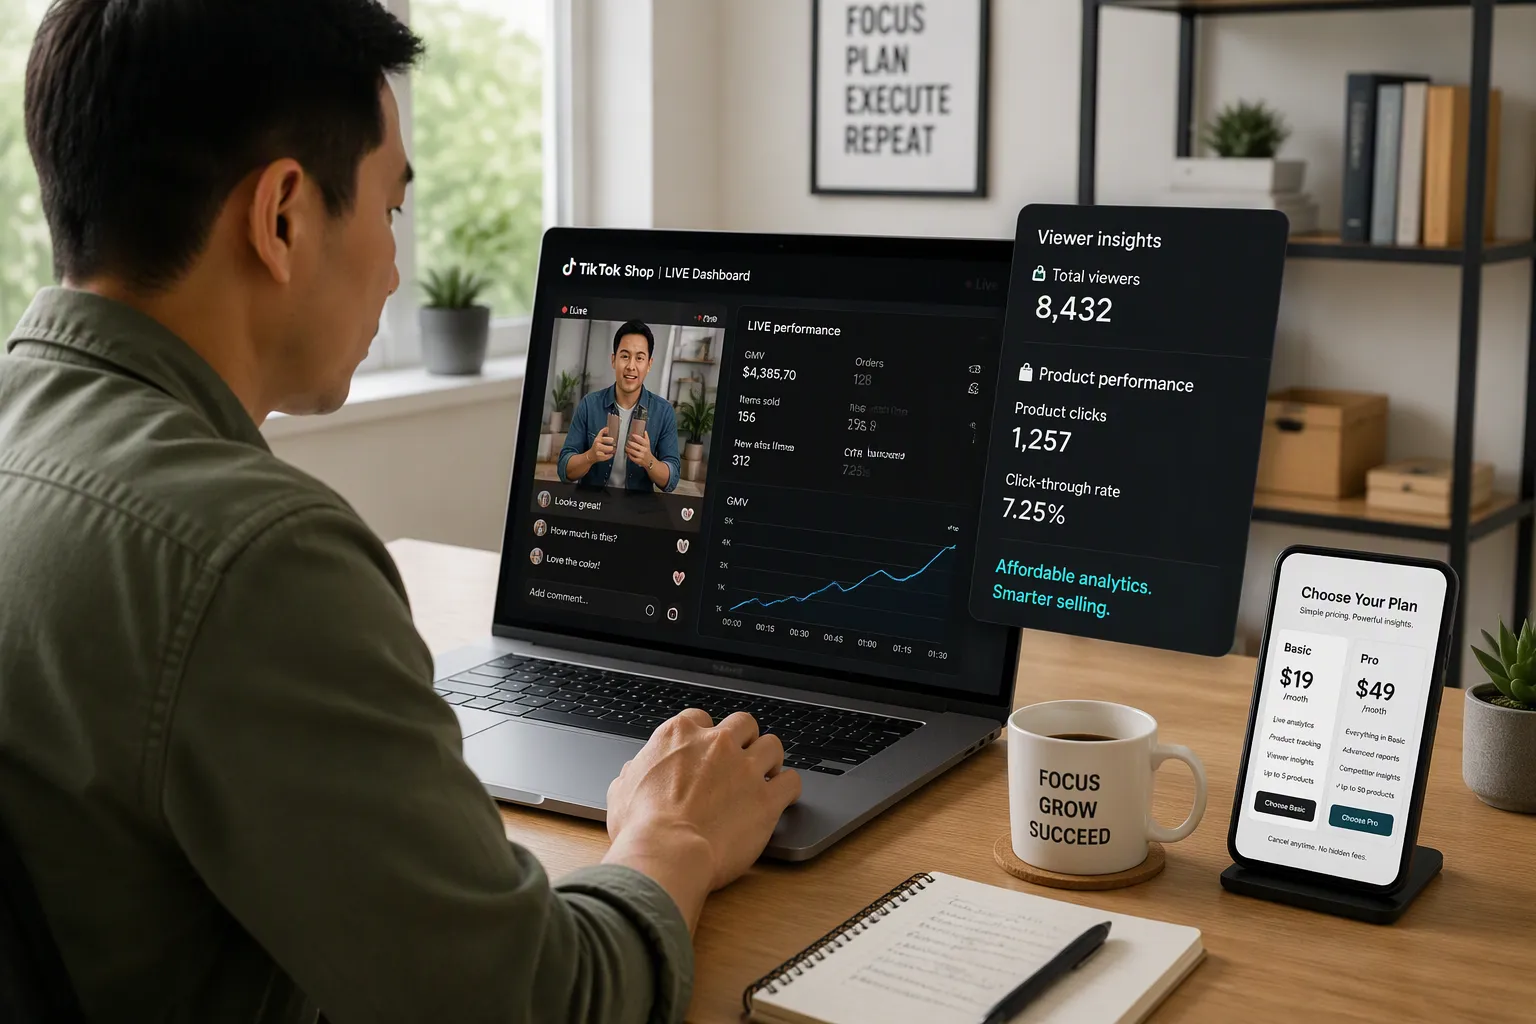
Price decides which tools small sellers can actually afford. EchoTik's entry plan costs about $9.90 per month billed yearly, and a free tier with limited lookups lets you test the platform before paying. Kalodata's Starter plan runs about $49.99 per month and offers no free tier. That gap matters when you sell under $50K monthly GMV and every subscription competes with ad spend. The tradeoff is narrower data windows: 30 days on Basic and 90 days on Pro, versus Kalodata's 90-day entry window. For most daily decisions, that window is enough.
Tool | Entry Plan | Mid Plan | Top Plan | Free Tier |
|---|---|---|---|---|
EchoTik | ~$9.90/mo (billed yearly) | ~$19.10/mo | ~$29.10/mo | Yes (limited lookups) |
Kalodata | ~$49.99/mo (Starter) | ~$109.99/mo (Professional) | — | No |
The Chrome extension overlay is the second advantage. It places data on the TikTok pages you already browse, so product research and live monitoring happen in one window. You gain an analytics layer without learning a second dashboard. During a live broadcast, you read viewer counts and product clicks without switching tabs. The overlay also shows stream metrics beside the video player, so hosts adjust mid-broadcast.
The third advantage is consolidation. EchoTik combines product tracking, creator metrics, and live stream statistics in one e-commerce analytics platform. It covers SEA, US, UK, MX, and ES markets, not just US rankings. AI tools handle script writing, sourcing match, translation, and title optimization. The platform syncs with TikTok automatically and alerts you when margins change, so you protect profit before it erodes. Competitors like Simptok mainly cover basic US monthly data. EchoTik delivers real-time tracking, multi-country coverage, and detailed creator databases instead. One subscription replaces several single-purpose tools.
Who Benefits Most
Sellers gain the clearest payoff. A real-time profit dashboard tracks hidden TikTok fees, and product-level analysis shows true earnings after each sale. Margin alerts fire when costs shift, so you act before a promotion eats your margin. Affiliates benefit too, because profit visibility and creator analytics drive smarter partnership choices. Use creator roi and influencer roi signals before you renew a deal. Compare three creators on engagement and commission history, then pick the one with proven conversion.
Agencies need broader tooling, and the evidence points to Shoplus for their feature depth. Small brands still gain from one affordable view of competitor intelligence and market intelligence. New sellers test ideas on the free plan and upgrade when lookups run out. Experienced sellers layer ai recommendations onto their existing workflow and skip manual list building. Agencies that manage many brands can still use EchoTik for creator discovery, then pair it with a deeper agency suite. Each group shares one outcome: faster decisions from cleaner data.
EchoTik stands out for profit tracking — real-time dashboards, alerts for margin changes, and detailed product analytics help users understand true earnings.
The combination explains why echotik - the best tool for tiktok shop analytics & insights keeps earning repeat use. Affordable pricing, an in-page overlay, and unified product, creator, and live analytics cover the daily questions sellers ask. Track live sales during a broadcast, review sales performance after it ends, and adjust the next stream. That loop is why echotik - the best tool for tiktok shop analytics & insights fits sellers who want profit clarity without enterprise pricing.
EchoTik gives you one dedicated TikTok Shop analytics platform. It combines product tracking, competitor analysis, live stream monitoring, and profit tracking at an affordable price. You get product research, creator roi signals, and live sales data in a single view.
The advantages stay simple. Entry pricing starts near $9.90 per month, a free tier lets you test the platform, and the Chrome extension overlays data on the TikTok pages you already browse. Multi-country coverage adds reach beyond US rankings. That mix explains why echotik - the best tool for tiktok shop analytics & insights suits sellers who want profit clarity without enterprise pricing.
Start with the free plan today. Install the extension, run one product search, and watch one live stream with the overlay on. You will see the difference in minutes.
FAQ
Does EchoTik offer a free plan?
Yes. A free tier with limited lookups lets you test the platform before you pay. The entry plan costs about $9.90 per month billed yearly. You can run a few product searches and confirm the data fits your workflow first.
What does the Chrome extension actually do?
The extension overlays data directly on TikTok pages. You read product metrics, shop numbers, and live stream stats without opening a second dashboard. Install it once, then browse TikTok as usual. The data appears beside the content you already see.
How far back does the data go?
Data windows depend on your plan. Basic covers 30 days, and Pro extends to 90 days. Most daily decisions fit inside that range. Check your plan before you run long-term comparisons.
Which markets does EchoTik cover?
EchoTik covers SEA, US, UK, MX, and ES markets. That reach goes beyond US-only rankings. You can compare shops and creators across regions inside one platform.
Can EchoTik show my real profit?
Yes. Profit tracking shows earnings after each sale and flags hidden fees. Logistics adjustments, chargebacks, and promotion deductions all reduce your take-home pay. Margin alerts fire when costs shift, so you protect profit before it erodes.
See Also
EchoTik.Live Best Third-Party TikTok Data Analytics Tool Boosts Seller E-Commerce Business
Powerful TikTok Analytics Tool For Data-Driven Business Growth
Discover EchoTik The More Professional TikTok Data Analytics Tool