TikTok API daTa

You can collect TikTok Shop data using API scrapers or no-code tools, making it possible for both technical and non-technical users to access valuable metrics like product views, purchases, and reviews. TikTok Shop’s analytics dashboard tracks engagement and conversion rates, helping you spot trends and improve business strategies. By examining hisTorical data, you can better understand how performance has evolved over time. With over 2 billion downloads and a young, active user base, TikTok drives impulse purchases and shapes e-commerce trends. Automation tools let you gather data over time, so you can analyze changes and make informed decisions.
Key Takeaways
You can collect TikTok Shop data using API scrapers or no-code tools to track product views, sales, and reviews over time.
Automation and scheduling help you gather consistent historical data, making it easier to spot trends and improve your business strategy.
No-code tools let non-technical users collect and analyze TikTok Shop data quickly and affordably without coding skills.
Watching market trends and competitor data on TikTok Shop helps you make smarter marketing and product decisions.
Follow TikTok’s rules and protect user privacy to avoid legal issues while collecting and using TikTok Shop data.
hisTorical Data from TikTok Shop
Data Types
When you explore TikTok Shop, you find many types of e-commerce data. This data helps you understand how products and sellers perform over time. You can use hisTorical data to track changes in sales, prices, and customer interest. The table below shows some important data types you can collect from TikTok Shop:
Data Type | Dimension | Key Metrics | Highlights |
|---|---|---|---|
By Category | Store counts, % share | Top categories: Womenswear & Underwear ( | |
Number of TikTok Shops | By Region | Store counts, % share | Leading regions: Indonesia (54.28K, 20.52%), Thailand (48.37K, 18.29%) |
Gross Merchandise Value (GMV) | By Category | GMV in USD, % share | Highest GMV: Beauty & Personal Care ($2.49B, 22.50%), Womenswear & Underwear ($1.39B, 12.56%) |
Gross Merchandise Value (GMV) | By Region | GMV in USD, % share | Top GMV regions: Thailand ($2.85B, 25.66%), Vietnam ($2.31B, 20.79%) |
Product Sales Volume | By Category | Units sold, % share | Leading sales: Beauty & Personal Care (370.09M units, 18.65%), Womenswear & Underwear (284.86M) |
Product Sales Volume | By Region | Units sold, % share | Top sales regions: Thailand (512.79M, 25.84%), Philippines (500.51M, 25.22%) |
Tip: You can use this data to compare different categories and regions. This helps you spot trends and find new opportunities for your business.
You can also track product listings, seller information, reviews, and prices. These metrics let you see how products perform over time. By collecting hisTorical data, you can measure growth and spot patterns that help you make better decisions.
Data Sources
You have several ways to collect TikTok Shop data. Some platforms, like Canopy Management, offer real-time analytics dashboards. These dashboards track engagement and conversion rates. They help you see which products and sellers perform best. You can use these tools to run A/B tests and improve your content strategies. This approach gives you reliable data and helps you make smart choices.
Other platforms, such as Superfiliate, track sales, impressions, page views, and affiliate activity. You can monitor key metrics like Gross Merchandise Value (GMV), Average Order Value, and Earned Media Value (EMV). These platforms also track content views, add-to-cart actions, and new visitors.
You can rely on these sources because they:
Track affiliate posting frequency and response rates.
Measure how well videos perform.
Monitor daily trends so you can react quickly.
Show the number of active affiliates each month as an early sign of program health.
Help you spot problems early and adjust your strategy.
Note: GMV is the main metric for sales success, but you should also watch costs like shipping, commissions, and seller fees.
When you use these data sources, you get a clear view of TikTok Shop performance. This helps you build strong strategies and grow your business with confidence.
Data Collection Methods
API Scrapers
API scrapers help you collect large amounts of TikTok Shop data quickly and accurately. You can use tools like Apify, Bright Data, and open-source GitHub scrapers to extract product listings, seller information, reviews, and prices. These tools work well for technical users who want to customize their data collection.
Nimbleway's TikTok API scraper achieves an average success rate of over 98% for accurate and comprehensive data extraction. This high success rate means you can trust the data you collect for your hisTorical analysis. Many scraper tools also report strong performance metrics:
Tool | Reported Performance Metrics | Accuracy | Speed / Throughput | Cost / Pricing |
|---|---|---|---|---|
Apify | Extraction completed in 6 seconds; cost $0.004 per run | Not explicitly stated | 6 seconds per extraction | Starts at $45/month |
Infatica | 98% data accuracy; 5-10 minutes setup time; 24/7 support with <5 min response | 98% accuracy | High-speed proxy infrastructure; supports concurrent requests | Starts at $25/month |
Octoparse | 95% accuracy; 3-5 minutes per 100 entries; IP rotation and CAPTCHA solving | 95% accuracy | 3-5 minutes per 100 entries | Starts at $99/month |
You can follow these steps to use an API scraper for TikTok Shop data:
Choose a scraper tool like Apify or Bright Data.
Set up your account and select the TikTok Shop scraping template.
Enter the URLs or keywords you want to track.
Run the scraper and download the data in CSV or JSON format.
Schedule the scraper to run daily, weekly, or monthly for continuous hisTorical data collection.
Tip: Scheduling automated reports reduces manual work and ensures you always have up-to-date analytics. You can compare different time periods and spot important trends by collecting data over months or even years.
Automation saves you time by handling repetitive tasks. It also keeps your data collection consistent, so you never miss changes in TikTok Shop trends.
No-Code Tools
No-code tools make TikTok Shop data collection easy for everyone, even if you do not know how to code. Platforms like Make.com, Apify, and Browse AI let you build workflows using drag-and-drop features. You can set up data extraction in minutes and start tracking key metrics right away.
No-code tools offer many benefits:
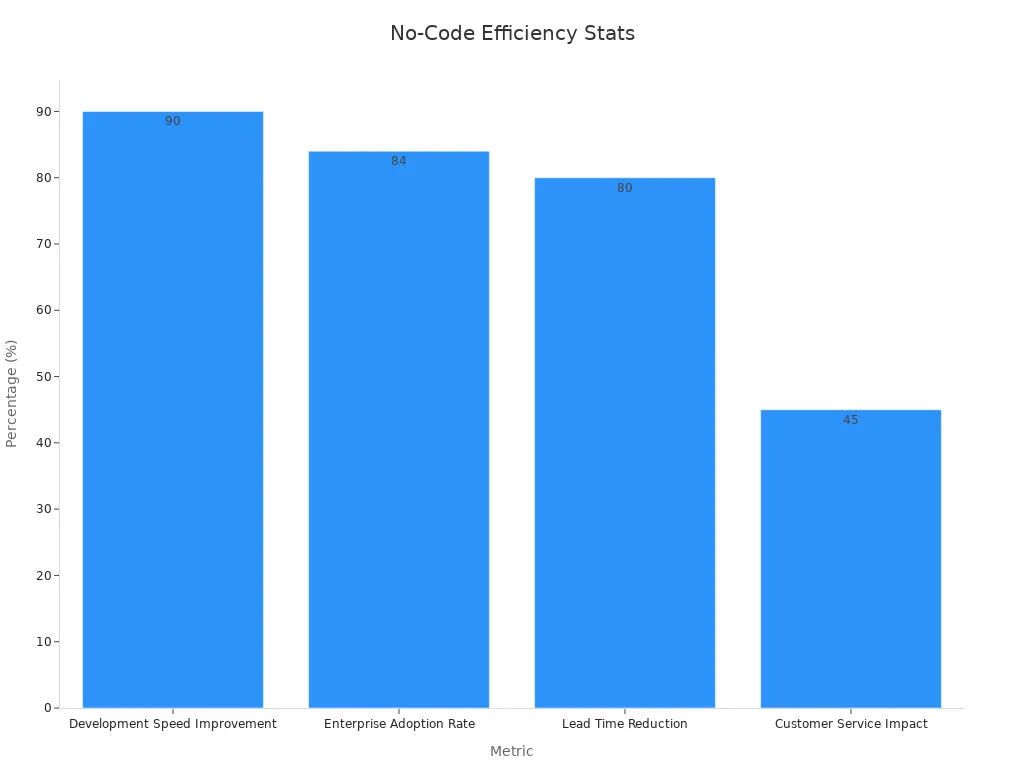
You can develop solutions up to 10 times faster than traditional methods.
84% of businesses use no-code or low-code tools to solve developer shortages.
85% of workers say these tools add value to their work.
Companies using no-code platforms see a 58% increase in revenue.
No-code tools use reusable components to speed up app design.
Metric | No-Code Tools vs Traditional Development |
|---|---|
Development Speed Improvement | Up to 90% faster development |
Cost Reduction | Up to 70-90% lower development costs |
Enterprise Adoption Rate | 84% of enterprises use no-code/low-code |
Example: Lead Time Reduction | 80% reduction launching a microsite in under 2 days |
Example: Customer Service Impact | 45% reduction in customer calls via no-code app |
Future Projection | 70% of new apps will be built on no-code/low-code platforms (up from under 25% in 2020) |
Integration Capability | Supports API consumption via visual configuration, making integration accessible to non-developers |
Scalability & Deployment | Enterprise-grade scalability, security, and multi-device deployment without IT bottlenecks |
Apify's no-code TikTok scraper tools have a run success rate of 98%. They can process 400-600 posts per second, making them reliable and fast for hisTorical data collection.
Here is how you can use a no-code tool to collect TikTok Shop data:
Sign up for a platform like Make.com or Apify.
Select a TikTok Shop data extraction template or workflow.
Drag and drop the actions you need, such as "extract product data" or "track reviews."
Set up scheduling to run your workflow automatically.
Export your data to Google Sheets or another tool for analysis.
Note: No-code tools let you schedule automated reports. This helps you track trends, audience growth, and engagement over time. You can also benchmark competitors and adjust your strategy based on real data.
Automation with no-code tools saves you time and ensures you always have the latest data. You can focus on analyzing results and improving your business instead of spending hours on manual data collection.
hisTorical Data Value
Market Trends
You can use hisTorical TikTok Shop data to spot important market trends. By tracking sales, order volume, and average order value, you see how the market changes over time. Many brands use TikTok Shop analytics to improve their marketing and product choices. Here are some key trends you can find:
TikTok Shop generated over $20 billion in gross merchandise value (GMV) in 2023.
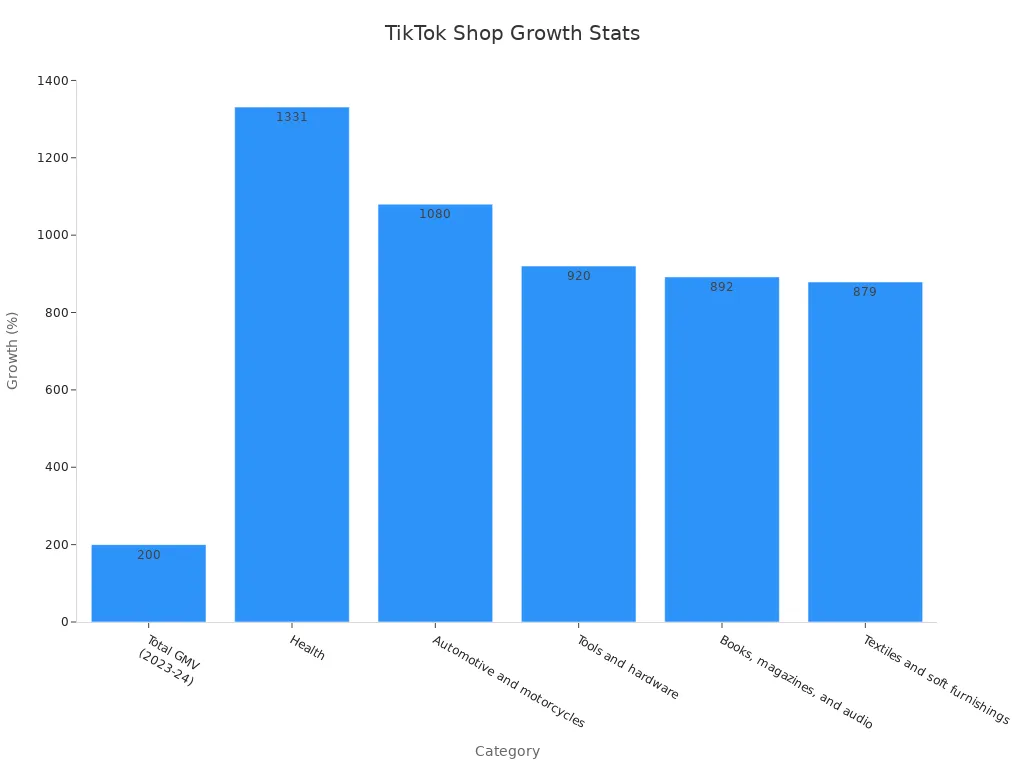
The platform saw a 200% year-over-year GMV increase, jumping from $11.09 billion in 2023 to $33.2 billion in 2024.
Health products grew by 1,331%, and automotive categories rose by 1,080%.
Over 50% of TikTok users make purchases after seeing products on the app.
TikTok Live prompts half of viewers to buy products.
Brands like CeraVe saw a 300% sales boost from viral TikTok moments, while e.l.f. Cosmetics increased conversions by 71% with organic content.
You can also analyze customer behavior by segmenting new and returning buyers, checking demographics, and tracking customer lifetime value. Tools like Saras Daton help you optimize marketing campaigns and inventory in real time.
Category | Year-over-Year Growth (%) |
|---|---|
Total GMV (2023 to 2024) | 200% |
Health | 1,331% |
Automotive and motorcycles | 1,080% |
Tools and hardware | 920% |
Books, magazines, and audio | 892% |
Textiles and soft furnishings | 879% |
Tip: Watching these trends helps you decide which products to promote and when to launch new campaigns.
Competitor Insights
You gain a big advantage by comparing your TikTok Shop performance with competitors. Analytical tools like Rival IQ, Pentos, and Kolodata let you track competitor pricing, trending products, and engagement rates. You can benchmark your sales, order volume, and average order value against others in your industry.
Compare TikTok Ads performance using industry benchmarks to find areas for improvement.
Analyze trends in ad data to spot peak engagement times and successful ad formats.
Set clear goals and key performance indicators (KPIs) for your campaigns.
Focus on metrics like impressions, clicks, click-through rate (CTR), conversions, and return on ad spend (ROAS).
Integrate TikTok Ads data with other platforms for a complete view of your digital strategy.
You can also use social listening to track brand mentions and sentiment. This helps you spot new trends and adjust your strategy quickly. By monitoring competitor metrics, you find market opportunities and optimize your marketing spend.
Note: Regularly reviewing hisTorical competitor data helps you stay ahead and make smarter business decisions.
Challenges and Solutions
Bot Detection
When you use scrapers or automation tools on TikTok Shop, you may face bot detection. TikTok uses security systems to spot and block bots. These systems look for strange patterns, like too many requests in a short time or missing browser fingerprints.
Common Bot Detection Triggers:
Sending too many requests too quickly
Using the same IP address for all requests
Not using real browser headers or cookies
Tip: You can avoid detection by acting more like a real user.
How You Can Reduce Bot Detection:
Rotate your IP addresses with proxy services.
Add random delays between your requests.
Use real browser headers and cookies.
Limit the number of requests per minute.
Solution | How It Helps |
|---|---|
Proxy Rotation | Hides your real IP address |
Random Delays | Mimics human browsing behavior |
Browser Headers/Cookies | Makes requests look more natural |
Request Throttling | Prevents overload and detection |
If you follow these steps, you can collect data more safely and avoid getting blocked.
Data Gaps
You may notice missing or incomplete data when scraping TikTok Shop. These gaps can happen for several reasons. TikTok updates its website often. Some products or reviews may disappear or change. Sometimes, scrapers miss data because of network errors or changes in page layout.
Why Data Gaps Happen:
TikTok changes its website structure.
Some data loads only when you scroll or click.
Network issues cause failed requests.
TikTok hides or removes old products.
Note: Data gaps can affect your analysis, so you need to check your data often.
How You Can Handle Data Gaps:
Use scrapers that support dynamic content and scrolling.
Schedule regular data checks and updates.
Compare your results with other sources.
Keep backup copies of your data.
If you watch for these issues and use the right tools, you can reduce data gaps and keep your analysis accurate.
Legal and Ethical Issues
Terms of Service
You need to understand TikTok’s Terms of Service before you collect data. TikTok sets rules for how you can use its platform and data. If you use scrapers or automation tools, you might break these rules. TikTok often blocks accounts or IP addresses that do not follow its terms.
Key points to check in TikTok’s Terms of Service:
You cannot use bots or automated tools to collect data without permission.
You must not copy, store, or share data in ways TikTok does not allow.
You need to respect TikTok’s intellectual property rights.
Note: If you ignore these rules, TikTok can suspend your account or take legal action. Always read the latest version of the Terms of Service before you start any data project.
You can find TikTok’s Terms of Service on their official website. Review them often because TikTok updates its policies.
Data Privacy
You must protect user privacy when you collect TikTok Shop data. Many countries have strict privacy laws, such as the General Data Protection Regulation (GDPR) in Europe and the California Consumer Privacy Act (CCPA) in the United States. These laws give users rights over their personal data.
Best practices for data privacy:
Collect only the data you need for your analysis.
Remove or hide any personal information, such as usernames or contact details.
Store your data securely and limit who can access it.
Delete data when you no longer need it.
Privacy Law | Region | Main Focus |
|---|---|---|
GDPR | Europe | User consent, data protection |
CCPA | California, US | User rights, data transparency |
Tip: Always tell users if you collect their data. Respect their choices and privacy rights. If you follow these steps, you can avoid legal trouble and build trust with your audience.
You can collect and analyze historical TikTok Shop data by following clear steps.
Upgrade to a TikTok Pro Account for analytics.
Export data regularly to keep long-term records.
Use both native and third-party tools to track key metrics like GMV, conversion rates, and engagement.
Metric Category | Key Metrics |
|---|---|
Revenue | GMV, Conversion Rates |
Customer Value | CLV, Repeat Purchase Rate |
Content Performance | Views-to-Click, Save Rate |
Choose tools that fit your skills. Stay informed about privacy laws and TikTok’s rules to use data responsibly. TikTok’s rapid growth shows that investing in analytics helps you stay ahead in e-commerce.
FAQ
How can you collect historical TikTok Shop data if you do not code?
You can use no-code tools like Apify or Make.com. These platforms let you set up data collection with simple drag-and-drop steps. You do not need programming skills.
Is it legal to scrape TikTok Shop data?
You must check TikTok’s Terms of Service before scraping. Some scraping methods may break TikTok’s rules. Always follow local laws and respect user privacy.
What types of data can you track from TikTok Shop?
You can track product listings, seller information, reviews, prices, and sales numbers. These data points help you understand trends and make better business decisions.
How do you avoid getting blocked when scraping TikTok?
Rotate your IP addresses, use real browser headers, and add random delays between requests. These steps help you look like a real user and reduce the risk of getting blocked.