TikTok api daTa

Businesses today use hisTorical e-commerce trends alongside TikTok API data to drive smarter strategies. By connecting past shopping patterns with current social media insights, brands can better understand what influences buyers.
Combining trend analysis with TikTok’s real-time data unlocks clear advantages for e-commerce growth.
Metric / Outcome | Description / Impact |
|---|---|
Large, engaged audience with strong purchasing power. | |
55% of impulse purchases in 2022 occurred on TikTok | Shows TikTok’s impact on spontaneous buying. |
TikTok Shop GMV of $11.09 billion in 2023 | Reflects strong e-commerce activity from TikTok. |
Improved conversion rates | In-app shopping makes purchases faster. |
Lower cost-per-click (CPC) | More cost-effective ads than other social platforms. |
Viral potential | Single videos can boost brands rapidly. |
Detailed TikTok API analytics | Brands track sales, engagement, and optimize plans. |
Key Takeaways
Combining historical e-commerce data with TikTok API insights helps brands spot trends and predict customer behavior more accurately.
TikTok’s large, engaged audience and real-time data enable businesses to boost sales through fast, interactive social commerce.
Brands can use TikTok analytics to improve marketing strategies, increase conversions, and manage inventory effectively.
Social commerce on platforms like TikTok makes shopping more fun and personal, encouraging impulse purchases and stronger customer loyalty.
Using AI-powered tools to integrate past trends with TikTok data allows companies to adapt quickly and stay ahead in a fast-changing market.
Historical Trends
E-commerce Milestones
E-commerce has transformed the way people shop. Over the years, several hisTorical milestones have shaped the industry. In the early 1990s, Pizza Hut introduced online ordering, making it easier for customers to buy food from home. Soon after, Amazon and eBay entered the market, setting new standards for online shopping. These platforms made it possible for anyone to buy or sell products with just a few clicks.
The late 1990s saw more innovation. PayPal launched, allowing secure online payments. Alibaba started in China, opening global markets to more sellers and buyers. By 2021, global e-commerce sales reached $5.2 trillion, showing how much the market had grown. Mobile commerce also became important. In 2022, U.S. mobile commerce revenues hit $431.4 billion, proving that shoppers now prefer using their phones.
Different regions have unique trends. Asia-Pacific leads with mobile-first and social commerce. North America focuses on omnichannel strategies and advanced logistics. Europe emphasizes regulations and sustainability.
Period/Event | Key Data & Figures | Trend Highlighted |
|---|---|---|
Early 1990s | Pizza Hut online ordering | Start of online retail |
1994-1995 | Amazon, eBay founded | Rise of major e-commerce platforms |
Late 1990s | PayPal, Alibaba launched | Online payments, global marketplaces |
2021 | Massive growth, global adoption | |
2022 (U.S.) | $431.4 billion mobile commerce revenue | Shift to mobile-first shopping |
2021-2027 (Projection) | 10.5% CAGR expected | Continued rapid expansion |
Shifts in Consumer Behavior
Consumer behavior has changed alongside these hisTorical milestones. Early shoppers valued convenience and novelty. As technology improved, people began to trust online payments and digital marketplaces. Today, shoppers expect fast delivery, easy returns, and secure transactions.
Mobile devices have changed shopping habits. Many people now browse and buy products on their phones. Social media also influences what people buy. Shoppers often discover new products through videos and posts. This shift has made e-commerce more interactive and personal.
Companies that understand these hisTorical shifts can better predict what customers want next.
Social Commerce Shift
Platform Influence
Social commerce has changed how people shop online. Businesses now use social platforms to connect with customers and drive sales. This shift started in the early 2000s when social networking websites grew rapidly. Companies saw new ways to reach buyers through these channels. Web 2.0 technologies made it possible for users to interact, share, and recommend products. As a result, shopping became more social and community-driven.
Social networking sites have fueled business revenue through social commerce strategies.
Studies of WeChat users show that social capital, ease of use, and online impulse buying shape social commerce adoption.
Web 2.0 tools enable collaboration and interactivity, making commerce platforms more engaging.
Platforms like WeChat stores allow transactions through social interactions and recommendations.
Research shows social commerce blends social and tech elements, changing consumer behavior and business models.
Market projections valued social commerce at $80 billion annually by 2020.
Social commerce now focuses on fun and experience, not just function.
Social media improves supplier-customer relationships, boosting sales and loyalty.
Social commerce platforms encourage users to discover products through friends, influencers, and interactive content. This approach builds trust and makes shopping more enjoyable.
TikTok’s Impact
TikTok has become a leader in social commerce. The platform attracts over 1.5 billion users, most under age 34. Brands use TikTok to reach Gen Z and millennials, who spend an average of 95 minutes daily on the app. Users open TikTok about 20 times each day, showing high engagement and retention.
Statistic | Description |
|---|---|
Over half of TikTok users interact with brand content every day. | |
Product discovery as primary reason for brand interaction | TikTok helps users find new products. |
500,000+ TikTok Shop merchants in the US | Shows rapid growth of TikTok’s commerce feature. |
37% of Americans under 60 purchased via TikTok Shop | Many consumers buy directly on the platform. |
36% of direct social commerce purchases on TikTok | TikTok holds a large share of social commerce sales. |
$23.3 billion global ad revenue in 2024 | Reflects TikTok’s commercial influence. |
Projected $34.8 billion ad revenue by 2026 | Indicates continued growth. |
2.5% average engagement rate | Higher than Instagram’s 0.5%. |
18% engagement rate for micro-influencers | Micro-influencers drive strong trends. |
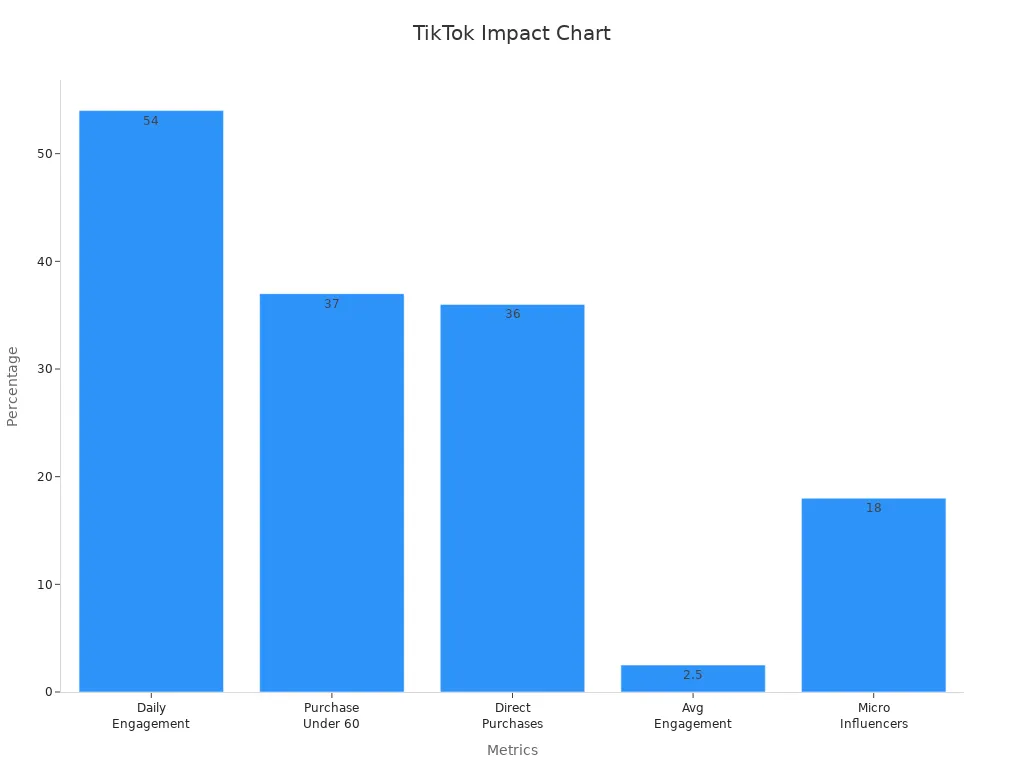
TikTok’s unique format encourages users to discover and buy products quickly. Over 55% of users have made impulse purchases after seeing TikTok content. Creators aged 18-24 produce most of the videos, fueling trends and engagement. Micro-influencers, with fewer than 15,000 followers, achieve engagement rates near 18%. This high interaction helps brands reach new customers and boost sales through authentic content and recommendations.
TikTok API Data

Data Insights
TikTok APIs and data scrapers give brands access to a wide range of e-commerce data. These tools collect information from TikTok Shop, influencer profiles, sales records, and video content. Brands use this data to track product views, sales numbers, and customer reviews over time. TikTok’s analytics tools also provide details about user engagement, such as likes, comments, shares, and audience demographics.
TikTok Shop data platforms, like Saras Daton, automate the extraction and structuring of TikTok Shop API data. This process helps brands understand customer behavior, sales trends, and marketing performance.
Some of the most valuable metrics include:
Revenue and order volume
SKU performance and inventory levels
Conversion rates and average order value
Customer lifetime value and product return rates
Brands can also access campaign metrics such as clicks, cost per click (CPC), click-through rate (CTR), and conversions. TikTok’s Ads Manager and Pixel tools help companies measure ad effectiveness and optimize campaigns. Third-party tools, like Adsmurai One Tag, improve tracking accuracy and cross-platform reporting.
E-commerce Use
E-commerce brands rely on TikTok API data to make better business decisions. By analyzing product views, sales, and reviews, companies spot trends and adjust their marketing strategies quickly. For example, e.l.f. Cosmetics increased conversions by 71% using TikTok data insights. Princess Polly improved ad efficiency by 20% through data-driven retargeting. CeraVe tracked viral trends and saw a 300% sales increase.
During the COVID-19 pandemic, TikTok e-commerce grew rapidly. More people shopped online and spent time on social media. TikTok Shop’s gross merchandise value (GMV) reached over $20 billion in 2023. More than half of users made purchases after seeing products on the platform.
TikTok API data helps brands respond to changing consumer habits and stay ahead in a fast-moving market.
Connecting historical and TikTok Data
Trend Patterns
Brands now combine hisTorical e-commerce data with TikTok API insights to spot new trends and predict customer behavior. They track metrics like engagement rates, conversion percentages, and sentiment analysis. These metrics help companies see how past shopping habits connect with current social media actions.
Engagement rates above 2% often lead to 4.5 times higher conversion rates, according to Sprout Social.
Predictive modeling with hisTorical data can forecast purchase intent with up to 85% accuracy.
Platforms like Pinterest show an average conversion rate of 2.9%, which outperforms many others.
Unified dashboards and metric hierarchies help brands map and analyze these trends across channels.
By using both old and new data, companies can adjust their marketing quickly. They learn what content works best and which products attract more buyers. This approach helps brands stay ahead in a fast-changing market.
Case Studies
Several brands have found success by linking hisTorical data with TikTok analytics. For example, REI used sentiment and interaction patterns from both past and current social data. This strategy improved their engagement by 167%, conversion rates by 23%, and average order value by 14%. Glossier focused on engagement and sentiment, which led to a 40% increase in conversion rates and a 60% rise in average order value.
Brand | Strategy Used | Key Results |
|---|---|---|
REI | Sentiment + interaction analysis | +167% engagement, +23% conversions |
Glossier | Engagement + sentiment focus | +40% conversions, +60% order value |
ASOS | Behavioral analytics for segments | -29% CPA, +13% new customers |
ASOS used behavioral analytics to segment their audience. This move reduced their cost per acquisition by 29% and increased first-time customer conversions by 13%. These examples show how brands can use data from both the past and present to drive better results.
Insights & Future
Action Steps
Industry leaders recommend a clear path for brands that want to connect historical e-commerce trends with TikTok API data. Companies should start by integrating TikTok data with past sales and marketing results using AI-powered analytics platforms. This approach helps teams uncover deep insights and spot new opportunities.
Combine TikTok API data with historical trend analysis on platforms like Kleene to reveal actionable patterns.
Measure the impact of each marketing channel, both online and offline, to understand what drives results.
Use predictive tools to test how changes in marketing budgets affect performance.
Track ROI based on real business outcomes, not just clicks or views.
Study TikTok metrics such as trending videos, engagement rates, and popular sounds to shape creative content.
Test the timing and frequency of posts by analyzing when followers are most active.
Use a unified analytics platform to avoid data silos and make smarter decisions.
Monitor content performance over time and adjust strategies to boost engagement and virality.
Marketers who follow these steps can quickly adapt to changing trends and maximize their reach on TikTok.
Predictions
The future of e-commerce will rely even more on predictive analytics and real-time data from platforms like TikTok. AI-powered models now forecast influencer performance, engagement trends, and conversion likelihood. These tools help brands estimate future ROI by finding patterns in past campaigns. They also predict if engagement rates will rise or fall and identify which influencers can drive the most sales or signups.
AI tools automate campaign optimization by shifting budgets to top-performing creators or content types.
Brand affinity scores help brands choose influencers whose audiences match their values and goals.
Fraud detection models protect investments by spotting fake followers and inauthentic engagement.
As these predictive models improve, brands will move from reacting to trends to anticipating them, gaining a strong edge in the fast-paced world of social commerce.
The connection between hisTorical e-commerce trends and TikTok API data shapes how brands grow online.
TikTok’s real-time data, such as hashtags and engagement, helps businesses spot what products and influencers are trending.
Companies use these insights to adjust marketing, manage inventory, and forecast sales, just as they did with past e-commerce data.
Automated data extraction lets brands react quickly to consumer shifts, giving them a strong edge.
Social data will keep changing e-commerce, making fast, data-driven decisions more important than ever.
FAQ
What is TikTok API data?
TikTok API data includes information from TikTok, such as video views, sales, influencer stats, and product reviews. Brands use this data to track trends, measure engagement, and improve marketing strategies.
How do brands use historical e-commerce trends?
Brands study past sales, customer habits, and market shifts. They use this knowledge to predict future trends, plan campaigns, and choose products that match customer interests.
Why is TikTok important for e-commerce?
TikTok helps brands reach large, active audiences. Its real-time data shows what products and influencers are trending. This helps companies adjust marketing and boost sales quickly.
Can TikTok API data improve sales forecasting?
Yes. TikTok API data tracks product views, sales, and engagement. Brands use these insights to predict demand, manage inventory, and plan promotions more effectively.
How did COVID-19 affect TikTok e-commerce?
COVID-19 increased online shopping and social media use. Many people turned to TikTok for product discovery. As a result, TikTok Shop sales and user engagement grew rapidly.
See Also
Exploring TikTok Analytics For Better Content Insights