Social media analyTics api

A social media analytics API helps e-commerce workers gather and study data from many sites. This tool lets brands watch historical trends and find useful ideas. These ideas help them make better business choices. AI-powered analytics and hyper-personalization are growing fast. E-commerce companies can get up to 35% more sales and 25% better conversion rates. About 76% of shoppers buy things because of social media. So, strong analytics and smart marketing are becoming more important in commerce.
Key Takeaways
Social media analytics APIs help online stores get and look at data from sites like Facebook and Instagram. This helps them do better in marketing and sales.
With these APIs, brands can watch important numbers like engagement, conversion rates, and customer lifetime value. This helps them make better business choices.
To use these APIs, brands need to plan, test, and update them. This makes sure data moves well and the insights are correct.
Some common problems are authentication errors, data problems, and API limits. But checking often and having good instructions can fix these issues.
Good security and following privacy laws keep customer data safe and build trust. This makes analytics safer and works better.
Social Media Analytics API
What It Is
A social media analytics api connects online stores with social networks. This tool gathers and sorts data from places like Facebook, Instagram, and Twitter. E-commerce teams use these APIs to check things like engagement rates and conversion percentages. They also look at cost per acquisition. These numbers show brands what their audience likes. They also help brands see how well their campaigns do over time.
Experts say social media analytics means collecting and studying audience data from social networks. This helps companies make smarter business choices. Marketers use analytics to find trends in how people act. They also measure how much money they make from social campaigns. AI and machine learning make these analytics better. They give real-time data and create reports automatically.
Companies such as Glossier, ASOS, and REI use social media analytics api tools to grow. Glossier raised conversion rates by 40% and order value by 60% with engagement and sentiment analysis. ASOS lowered cost per acquisition by 29% and got 13% more first-time buyers using behavior analytics. REI saw a 167% jump in engagement and a 23% rise in conversion rates after using sentiment and interaction pattern analysis.
A social media analytics api helps e-commerce businesses turn raw social media data into useful insights. This helps them find new trends and improve marketing plans. It also helps them make more money. Making decisions based on data leads to more customers and higher profits. E-commerce brands using advanced analytics see a 15-20% boost in ROI.
Some common social media analytics api examples are:
Twitter API: Gets tweets, user profiles, and trends. Lets you read, post, get live updates, and manage ads.
Instagram API: Gives content management and insights for business accounts. Lets personal accounts share profiles and media.
Facebook API: Handles content, ads, and chatbots. Needs secure user consent for data access.
These APIs let apps get, study, and manage social media data. They help with marketing and business intelligence.
How APIs Work
A social media analytics api links e-commerce platforms with social networks using secure endpoints. Developers sign up their apps with the social network and get credentials. The API lets the app ask for social media data like posts, comments, likes, and user profiles. This data goes into the e-commerce system. Analytics tools then process and show the data.
The API Workflows Specification helps developers set up API endpoints in clear steps. This makes it easier for people and computers to use the social media analytics api. Developers can build workflows that collect and study social media data automatically. This keeps business processes steady even when APIs change.
A normal workflow for using a social media analytics api is:
Sign up the app with the social network and get credentials.
Prove requests are safe to get data.
Get social media data using certain endpoints like posts or engagement.
Study the data with built-in or custom analytics tools.
Show results in dashboards or reports for e-commerce teams.
Tip: Always update documentation and workflows when the social media analytics api changes. This keeps data quality high and analytics correct.
Social media analytics api documentation often has examples, guides, authentication info, and status codes. Clear documentation helps everyone learn how to use the API. Interactive demos and real-time examples make learning faster and easier.
E-commerce teams use social media analytics api tools to get real-time insights about customers. These insights help brands make experiences personal, guess what people want to buy, and improve campaigns. For example, engagement rates over 2% can mean 4.5 times more conversions. Companies that track sentiment see 21% more purchases and better customer lifetime value.
Social media analytics api tools help find new chances and trends. They let e-commerce brands track social media numbers over time. Brands can compare how they do on different platforms and make smart choices. Real-time data and analytics help businesses keep getting better and stay ahead of others.
E-Commerce Analytics
Key Metrics
E-commerce brands use analytics to see how well they do. They watch important numbers to check their business plans. These numbers help teams learn what customers do and find patterns. They also help teams sell more. Dashboards put together data from Amazon, Shopify, email, and social media. This gives teams one place to see everything. It helps them make better choices.
Some important social media metrics and analytics are:
Traffic sources: Show where customers come from and which channels work best.
Conversion rates: Tell what percent of visitors buy or sign up.
Average order value (AOV): Shows how much people spend each time.
Customer lifetime value (CLV): Tells how much money a customer brings over time.
Cart abandonment rates: Track how often people leave without buying, so brands can fix checkout.
Engagement rates: Show how much people like and interact with posts.
Return on Ad Spend (ROAS) and Customer Acquisition Cost (CAC): Check if paid ads work well.
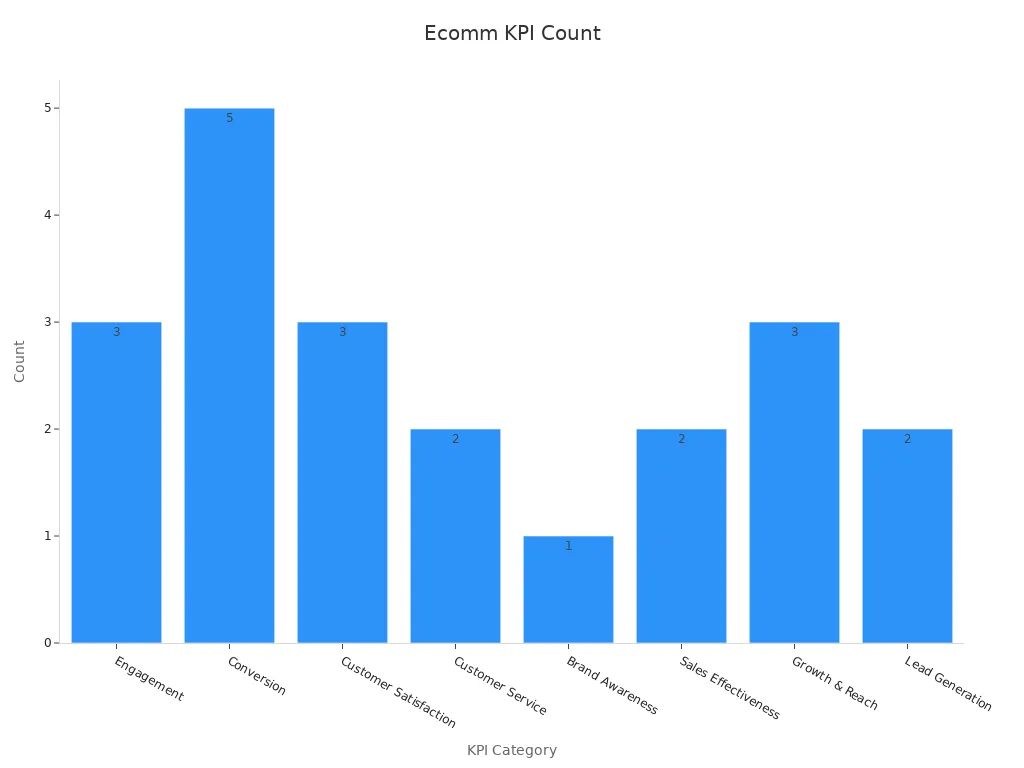
KPI Category | Key Performance Indicators (KPIs) | Description / Importance |
|---|---|---|
Engagement | Applause Rate, Average Engagement Rate, Amplification Rate | Shows if people like, share, or interact with posts. This means the content is interesting and people care about it. |
Conversion | Click-Through Rate (CTR), Bounce Rate, Cost per Click (CPC), Cost per Thousand Impressions (CPM), Revenue | Checks if ads bring people to the site, if they stay, and if the ads make money. |
Customer Satisfaction | Customer Satisfaction Score (CSAT), Net Promoter Score (NPS), Customer Lifetime Value (CLV) | Tells if customers are happy, loyal, and worth a lot to the brand. |
Customer Service | Average Response Time, Response Rate | Shows how fast and often brands answer questions online. This matters for sales and happy customers. |
Brand Awareness | Social Share of Voice (brand mentions, hashtag usage, sentiment) | Checks how much people talk about the brand and if they say good things. |
Sales Effectiveness | Average Order Value from Social Traffic, Shopping Cart Abandonment Rate from Social Traffic | Shows how much money comes from social media and if people finish buying. |
Growth & Reach | Follower Growth Rate, Story Completion Rate, Post Reach and Impressions | Tracks if more people follow, watch stories, and see posts. |
Lead Generation | Cost Per Lead (CPL), Traffic-to-Lead Ratio | Checks if social media brings new leads and if traffic turns into buyers. |
Note: Advanced analytics, like predictive models and audience engagement analysis, help brands make offers just for you and guess what will happen next.
Platform Benchmarks
E-commerce analytics platforms give brands numbers to compare how they do. Conversion rates change by device. People on computers buy more than people on phones. Food & Beverage brands have the highest conversion rate at about 4.9%. Home & Furniture brands have a lower rate at about 1.4%. Brands look at first-time and repeat customers, and which channels work best.
Studies show that using both online and offline data helps a lot. For example, linking ads in different places can make in-store sales go up by 168%. What you sell also matters. Simple things sell better online. Expensive things may sell better in stores. Holidays and sales can make more people shop, so watching data over time is important.
Brands use these numbers to set goals and make marketing better. Social media engagement and audience engagement analysis help brands change plans and sell more. By watching social media metrics and analytics, brands can keep up and react to changes in the market.
Historical Data
Trend Analysis
E-commerce brands use old social media data to find patterns. They watch analytics over time to see what gets popular. They also see what loses interest. This helps brands learn about past e-commerce trends. It helps them make better plans for the future.
Long studies show that mixing social media data with real-world facts gives better answers. For example, researchers use charts to show how customer feelings change. These charts show good and bad feelings over months or years. Some charts compare things like engagement and sales at the same time. Other charts show how many things change together. This makes it easier to find new chances.
The YCharts US Index of Consumer Sentiment shows how people feel about money and the economy. It uses old data to show trends, like getting better after hard times or changes during big events. Brands use this to change their e-commerce plans and react to how people feel.
The quantilope Consumer NOW Index watched people from July 2020 to June 2022. It showed how people used different platforms, like a big jump in TikTok use. Brands that watched these numbers could change their marketing fast. They could go where their customers spent time online.
Watching numbers over time helps brands set good goals. It helps them see progress and react to market changes. This helps them make smarter choices and get better results.
Customer Behavior
Old social media data helps brands see what customers do. By looking at past actions, brands can guess what customers might do next. Analytics tools mix survey answers, buying history, and engagement data. They use this to guess what will happen in the future.
Researchers use the Theory of Planned Behavior and machine learning to guess if people will buy. They look at attitudes, social pressure, and control over buying. Machine learning models trained on old data can guess buying with high accuracy, sometimes over 92%. This helps brands reach the right people and get better marketing results.
Brand | Strategy Used | Key Results |
|---|---|---|
Sentiment and interaction analysis with historical and TikTok data | Engagement +167%, Conversion +23%, Order value +14% | |
Glossier | Engagement and sentiment focus | Conversion +40%, Order value +60% |
ASOS | Behavioral analytics for audience segmentation | Cost per acquisition -29%, New customer conversions +13% |
Brands use analytics to find good customer groups and learn what they like. Predictive analytics looks at old buys and engagement to guess what people want next. This helps brands market better and keep customers coming back.
Customer behavior studies mix survey data, like Net Promoter Score and Customer Satisfaction, with real actions from social media. Behavioral segmentation puts people in groups by what they do. Predictive analytics uses these groups to score how likely someone is to buy. Brands then change their ads, bundle products, or fix websites using these ideas.
Customer behavior analytics tools look at big data sets to find trends in satisfaction and churn.
Surveys and real buying data can show different things. Brands use both to see the whole picture.
Knowing these differences helps brands fix problems and make the customer journey better.
Platforms like Qualtrics help brands collect, study, and use this data for better guesses.
Brands that watch old e-commerce trends and customer actions over time get more engagement, better conversion rates, and stronger loyalty.
Choosing an API
Features to Consider
Picking the right social media analytics api helps brands see how well they do. Each platform has its own special features. Brands should pick APIs that let them change metrics, check KPIs on different networks, and watch engagement as it happens. It is important for marketing teams to make custom reports and compare paid and organic posts.
Feature / Metric Category | Description / Examples |
|---|---|
Make custom reports and KPIs, set up reports automatically | |
Data Flexibility & Integration | Get lots of data, connect with tools like Google Big Query |
Cross-Network KPIs | Check results on many social platforms |
Engagement Metrics | Watch engagement, followers, and hashtags |
Content Performance | See how well posts do on each network |
Ad Analytics | Compare paid ads and regular posts |
Competitive Benchmarking | See how you do against other brands |
Social Listening | Watch for mentions and keywords in posts and comments |
Looking at top social media analytics api platforms helps leaders choose.
Platform | Core Features | Best For | Notes on API and E-commerce Integration |
|---|---|---|---|
Buffer Analyze | Post and story analytics, audience insights | Small and medium businesses | Low cost, simple analytics |
Google Analytics | Social traffic, conversions, Google Ads connection | Brands focused on websites | Checks how social media affects sales |
Zoho Social | Real-time tracking, CRM connection | Start-ups, small businesses | Works with Zoho CRM to get leads |
Quintly | Custom options, cross-platform checks | Big companies, agencies | API lets you add to your own systems |
Brandwatch | Sentiment and influencer analytics | Large companies | Good for social listening and sentiment checks |
Rival IQ | Competitor checks, benchmarking, machine learning | Learning about competitors | Gives benchmarking and competitor info |
Whatagraph | Cross-channel analytics, e-commerce tool links | Marketing teams | Over 50 connections, including e-commerce and CRM |
Tip: Teams should look for things like influencer marketing ROI, campaign analytics, and customer care metrics. These help brands keep up in a fast-changing market.
Integration
A social media analytics api should work well with business systems. Brands often need to mix data from many places. APIs with flexible options make this easier.
Some companies use API-led integration to help both online and store sales. This helps them use new tech fast and support many channels. Unilever uses APIs again and again to start digital projects quickly. ASICS made a new platform in six months by reusing APIs, which made IT projects faster. WatchBox grew into new areas 50% faster with a platform that uses APIs.
To connect a social media analytics api, teams should:
Check the documentation for supported platforms and data types.
Try API endpoints with test data.
Link the API to dashboards or business tools.
Watch the data flow and fix any problems.
Update the connection as platforms change.
Note: Good integration lets brands track campaigns, customer engagement, and sales in one spot. This helps teams make better choices and grow faster.
Implementation Steps

Setup
To connect a social media analytics api to an e-commerce site, teams must plan well. First, they sign up their app with each social media site to get API keys and tokens. Then, they look at the API documentation to learn about endpoints, request types, and responses. Setting up a coding space that works with HTTP requests, like Python or JavaScript, makes things easier.
Here is a simple guide for setup:
Sign up the app with social media sites to get API credentials.
Read the API documentation to learn about endpoints and data types, like user engagement and demographics.
Set up a coding space and add needed libraries.
Make API calls and keep authentication safe.
Get data in JSON format and use tools like Pandas to read it.
Set up automatic data collection for real-time insights and reports.
Test the setup to check for API limits, data problems, and errors.
Watch how things work and update credentials when needed.
Tip: Set clear goals and make sure your data is good. Real-time insights need strong connections and correct data flow.
Common Challenges
Teams can run into problems when connecting a social media analytics api. Authentication errors happen if keys are missing or wrong. Rate limits can stop requests if too many are sent at once. Timeouts and slow servers can mess up real-time data. Wrong endpoints or parameters can cause errors, like 404 or 400 codes.
Other common problems are:
Data problems, like missing details or old history.
Version issues when APIs change or remove features.
Debugging is hard and needs regular care.
Bad documentation makes fixing problems tough.
Security risks if API keys are not kept safe.
A messaging layer that sorts errors helps teams fix things fast. Testing and watching the setup keeps it working well. Teams should talk to API providers to solve problems and learn about updates. By fixing these issues, brands can keep real-time data and get helpful insights for their e-commerce plans.
Best Practices
Maximizing Value
E-commerce teams can get more from social media analytics APIs by using smart strategies. Experts say APIs should be made so they can be used again. This lets brands use the same tools for many projects. It saves time and money. Teams should use visual flow builders to make work faster and cut down on mistakes. These tools help everyone work together, even if they are not tech experts. Fine-grained access control keeps data safe by letting only the right people see it.
Brands should watch key performance indicators to get the best results. They need to track things like conversion rates, engagement, and sales. This helps teams know what works well. Using dynamic pricing and strong partner programs can make APIs more valuable. Brands should add monetization at the right time to help them grow. They also need to focus on important API endpoints, like product details and payments. This keeps analytics quick and dependable.
Some other best practices are:
Use caching to make analytics faster and lower server work.
Set rate limits to protect systems but not block real users.
Keep API designs simple so they are easy to fix and improve.
Use content delivery networks to make analytics faster everywhere.
Make error handling better so problems are easy to find and fix.
Tip: Brands that do these things get better insights from data. They also find new trends faster, get more sales, and build stronger customer bonds.
Continuous Improvement
Continuous improvement helps keep analytics APIs working well for business needs. Many groups use methods like Six Sigma, Lean, TQM, and Kaizen. These help teams spot problems, check how things are going, and keep getting better. The DMAIC process—Define, Measure, Analyze, Improve, Control—guides teams step by step.
Methodology | Key Focus | Benefit for Analytics |
|---|---|---|
Six Sigma | Data-driven improvement | Raises conversion rates and cuts errors |
Lean | Efficiency and waste reduction | Makes analytics faster and more reliable |
TQM | Quality management | Keeps analytics results steady |
Kaizen | Small, ongoing changes | Helps teams find new insights often |
Teams use tools like the 5 Whys and fishbone diagrams to find out why problems happen. They watch KPIs and use business intelligence tools to see trends. Leaders and workers both help make a culture of always getting better. Regular feedback and checks make sure analytics stay right and help with marketing and sales goals.
Data and Privacy
Security
Security is very important for e-commerce brands using social media analytics APIs. These APIs work with lots of private data, like customer profiles and what people buy. They also use details about how people interact online. Companies must keep this data safe from hackers and other dangers. Security teams use special tools to find weak spots. SAST checks the code for hidden problems. DAST tests the API while it is running to find real issues. IAST uses both ways to look even deeper. Fuzzing sends random stuff to the API to find bugs.
API attacks have gone up by about 40% every year. Big companies like Facebook and Uber have had data leaks. Millions of users had their data stolen. Hackers target APIs to get personal or money information. Brands use strong passwords, encryption, and controls to stop this. They also watch data traffic all the time and set alerts for strange things. Regular checks and many layers of safety help protect data. Security teams need to plan for problems and teach workers about risks.
Companies that always watch and use automation have better safety and fewer data leaks.
Compliance
Following data privacy laws is a must for brands using social media analytics APIs. Many rules tell companies how to collect, store, and use data. Some important rules are GDPR, CCPA, HIPAA, PCI DSS, COPPA, PIPEDA, and the APEC Privacy Framework. These rules say brands must keep good records, control who sees data, and act fast if something goes wrong.
Companies should:
Know which laws fit their data.
Make lists of all their data.
Use encryption and controls for access.
Teach workers about privacy rules.
Do regular checks and look for risks.
Have plans for problems and check vendors.
Rules like PCI DSS v4.0 and DORA say brands must always find and list all APIs. Brands need to match security checks to these rules and fix problems. Watching in real time and looking for threats helps spot bad use and get ready for checks. Dashboards show which APIs follow the rules and which do not. Linking with security tools helps gather proof and respond to problems.
Doing these things helps brands earn trust, avoid fines, and do better than others.
Social media analytics APIs help brands do better in marketing and sales. Teams look at data to see how they are doing. They check trends and make reports that fit their needs. These APIs show which posts work best and help get more likes and comments. Brands learn from looking at data from different sites and from the past. This helps them make smarter choices using data. Leaders who use good tips and pick the right API get better results and keep growing.
Check how well you are doing and make plans better
Get automatic checks on posts to get more likes
Make reports you can change and share with your team
FAQ
What is a social media analytics API?
A social media analytics API helps brands get and look at data from social networks. Teams use it to watch engagement, check how campaigns do, and find trends. These trends help make marketing plans better.
How can e-commerce brands use historical data from social media?
E-commerce brands use old data to find patterns and guess what customers might do. This data shows what worked before. It helps teams make smarter plans for new marketing.
What are common challenges when integrating a social media analytics API?
Teams often have problems like login errors, bad data, and hitting API limits. They also need to keep up with changes and make sure data is safe.
Are social media analytics APIs secure?
Most APIs use strong safety tools like encryption and access controls. Brands should use good habits, keep passwords safe, and watch for threats to protect customer data.
See Also
Top Tools To Analyze Your TikTok Performance Effectively