TikTok Live View Counter: Track Competitor GMV & Sales Live

Outline
Quick answer
Why sellers search for a TikTok live view counter
What a live view counter can and cannot tell you
Why competitor GMV and sales need context
EchoTik public data points checked in June 2026
May 2026 competitor live data checklist
Step-by-step workflow with EchoTik
How to turn competitor data into your own live strategy
FAQ
Quick Answer
A TikTok live view counter helps sellers track how many viewers are watching a live room. But for TikTok Shop operators, the real value is not the viewer number itself. The real value is understanding what happens when traffic changes.
A serious TikTok Shop live analysis should track live viewers, peak viewers, product list changes, sales signals, estimated GMV, follower growth, pitch timing, product sequence and audience response together.
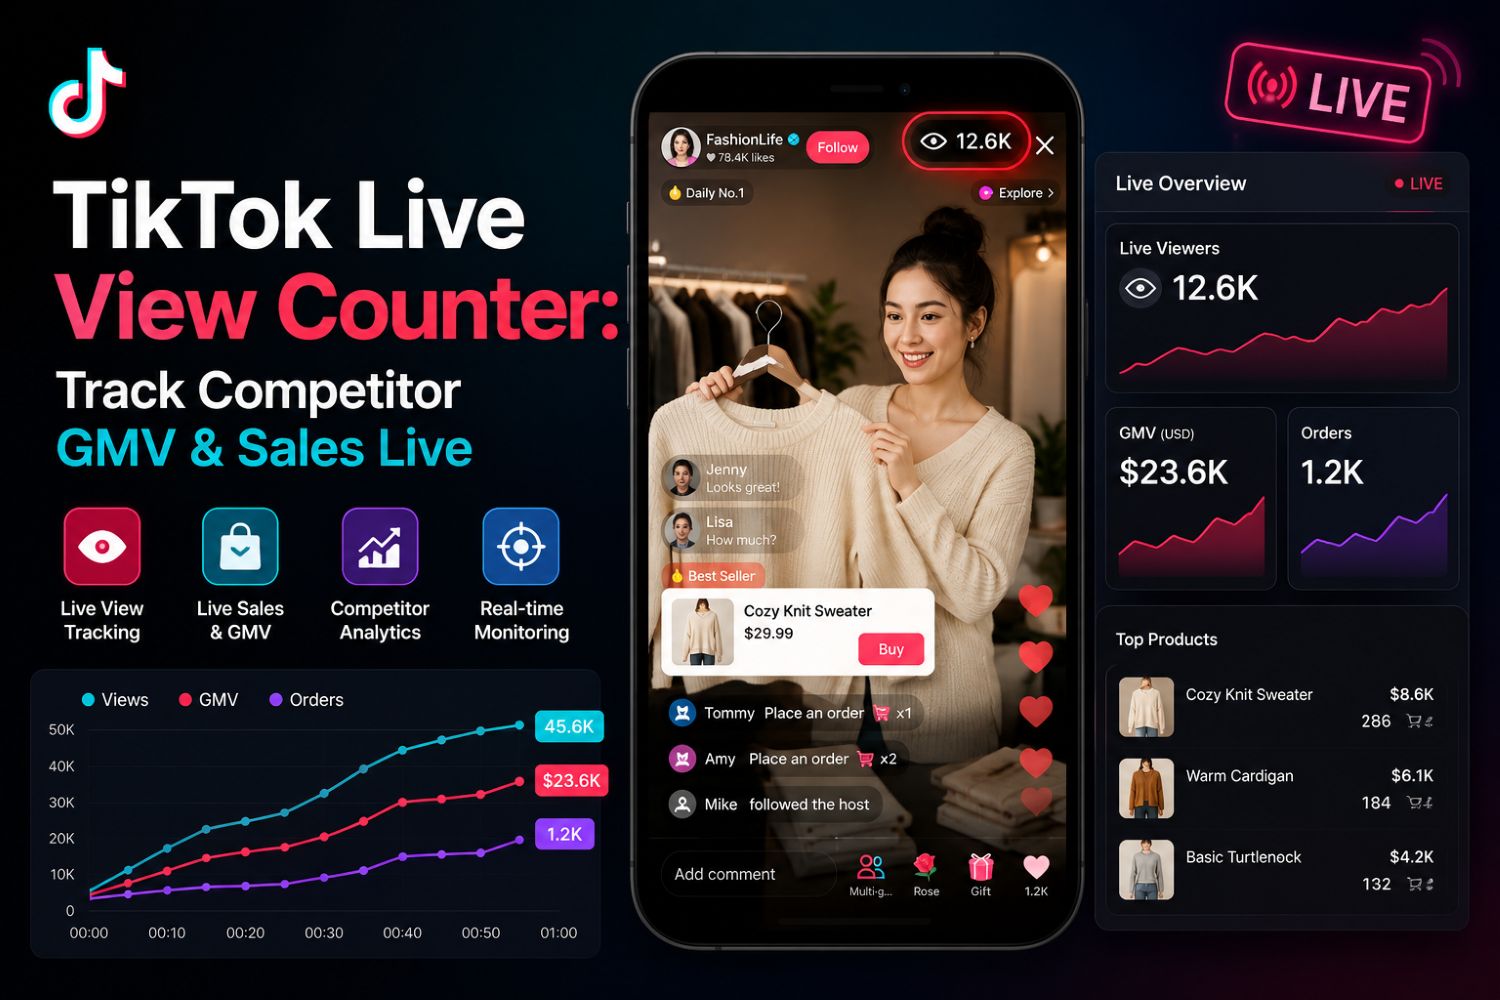
This is where EchoTik Live Monitor is useful. EchoTik states that its live monitor can collect minute-by-minute live streaming data, analyze live traffic, products, audience and sales pitch, automatically extract product lists, calculate sales volume and GMV based on big data, and cross-analyze sales pitch, traffic and sales.
For sellers, this turns live monitoring from “watching competitors” into an actual operating system.
Why People Search “TikTok Live View Counter”
Most people searching this keyword are not just curious about viewer count.
They usually have a practical business problem:
Their own TikTok live room has traffic but weak sales.
A competitor’s live room seems to sell more with similar products.
They want to know which product is driving orders.
They need to understand when traffic peaks.
They want to copy the structure, not blindly copy the script.
They need live data before deciding which products or creators to test.
So this article should not be written like a simple tool list. The right angle is competitive live commerce analysis.
A TikTok live view counter is only the first layer. The deeper question is:
When the competitor’s viewers increased, what product were they showing, what pitch did they use, and did sales move at the same time?
What a TikTok Live View Counter Can Tell You
A basic live view counter can show:
Signal | What It Helps You Understand |
|---|---|
Current live viewers | How much real-time attention the room has |
Peak viewers | The strongest traffic moment during the session |
Viewer trend | Whether the room is gaining or losing attention |
Live duration | How long the host can keep the room active |
Follower growth during live | Whether the live room turns viewers into followers |
These numbers are useful, but they are not enough.
A live room with high viewers may still have weak product conversion. A smaller live room may sell better if the host has stronger trust, better product sequencing and clearer offers.
What a Live View Counter Cannot Tell You Alone
Viewer count alone cannot tell you:
Which product actually drove sales
Whether the audience had buying intent
Whether the host’s pitch created conversion
Whether traffic came from loyal followers or short-term exposure
Whether the GMV was concentrated in one product or spread across many
Whether the live room can repeat the result next week
That is why sellers need a live analytics workflow, not just a counter.
Why Competitor GMV and Sales Need Context
When analyzing competitor GMV, sellers should be careful with wording. Unless you are looking at your own TikTok Shop backend, third-party tools usually provide observed or estimated signals based on accessible data, product movement and platform behavior.
That does not make the data useless. It means you should use it as market intelligence, not as official accounting.
The best way to use competitor live GMV data is to compare patterns:
Which products appeared before sales increased?
Which pitch happened before viewer growth?
Which product stayed pinned during high-traffic moments?
Which segment created follower growth?
Which live rooms repeated strong performance across multiple sessions?
This is how experienced operators read live data. They are not chasing one big number. They are reverse-engineering the live room mechanism.
Verified EchoTik Data Points Checked in June 2026
Use this section as the real-data block inside the article.
EchoTik Public Data Point | Why It Matters for TikTok Live View Counter Research |
|---|---|
EchoTik Live Monitor collects minute-by-minute live streaming data | Helps sellers see traffic changes during a live session |
EchoTik analyzes live traffic, products, audience and sales pitch | Connects viewer count with product and script behavior |
EchoTik automatically extracts product lists | Helps identify which products competitors are pushing |
EchoTik calculates sales volume and GMV based on big data | Helps sellers estimate competitor live performance |
EchoTik cross-analyzes sales pitch, traffic and sales | Helps find the moments that may drive conversion |
EchoTik Data API covers real-time live details, total viewers, peak viewers, follower growth during live and live GMV | Useful for teams building dashboards or internal reporting |
EchoTik E-commerce Analysis includes 12 live-streaming dimensions and over 40 metrics/charts | Supports deeper live room comparison |
EchoTik homepage positions the platform for product selection, influencer identification, live stream and video optimization | Shows live analytics is part of a broader TikTok commerce workflow |
These are publicly readable EchoTik data points checked this month, not invented campaign results.
May 2026 Competitor Live Data Checklist
Do not publish fake competitor GMV numbers. Pull this table from EchoTik Live Monitor, EchoTik API, your own exports or manually verified live room observations.
May 2026 Data Field | What to Pull | Why It Matters | EchoTik Source |
|---|---|---|---|
Competitor account | TikTok live account name | Identifies the live room being monitored | Live Monitor |
Live date | Session date in May 2026 | Builds monthly comparison | Live Monitor |
Live start time | Start time by market timezone | Finds strong time slots | Live Monitor |
Live duration | Total live length | Measures operating intensity | Live Monitor |
Total viewers | Full-session viewer count | Shows total traffic exposure | API / Live Data |
Peak viewers | Highest concurrent viewer point | Identifies strongest traffic moment | API / Live Data |
Average viewers | Estimated average attention level | More stable than peak alone | Live Monitor |
Follower growth during live | Followers gained in session | Shows audience trust and retention | API / Live Data |
Product list | Products shown during live | Reveals competitor product structure | Live Monitor |
Product display order | Sequence of promoted products | Shows traffic-to-product matching | Live Monitor |
Estimated sales volume | Sales signal by product/session | Helps estimate conversion strength | Live Monitor |
Estimated GMV | GMV signal based on big data | Helps compare live room value | Live Monitor |
Sales pitch timestamp | When key scripts/offers happened | Links language to sales movement | Live Monitor |
Traffic spike timestamp | When viewers rose quickly | Finds hook or product trigger | Live Monitor |
Sales spike timestamp | When orders likely increased | Finds conversion moment | Live Monitor |
Top product in live | Product with strongest movement | Guides product testing | Product Data |
Host/script pattern | Demonstration, discount, urgency, Q&A | Helps rewrite your own live script | Manual + Pitch Extraction |
Final action | Test product, test pitch, monitor again, ignore | Turns data into execution | Manual scoring |
This table makes the article AI-search friendly because it gives a complete, structured answer. It also gives your SEO page a practical data framework that competitors usually do not include.
How to Use EchoTik as a TikTok Live View Counter
Step 1: Choose the Competitor Live Room
Start with competitors who sell similar products, target the same market or use creators you may want to work with.
Do not monitor random large live rooms. A beauty live room with massive traffic may not help a home-goods seller. The closer the competitor is to your product category, the more useful the data becomes.
Use EchoTik E-commerce Analysis to find products, influencers, categories and live rooms worth monitoring.
Step 2: Set Up Live Monitoring
EchoTik’s live monitor page says the setup has three steps:
Search for the account you want to monitor.
Set the monitoring duration.
Set the notification method.
This is important because live commerce often happens outside your working hours. Human watching is inconsistent. Cloud monitoring makes the data easier to collect and review later.
Step 3: Track Minute-by-Minute Viewer Changes
Look beyond the peak number.
Ask:
When did viewers increase?
What was the host saying at that moment?
Which product was being shown?
Was the spike caused by a product demo, discount, interaction or creator behavior?
Did viewers stay, or did they leave quickly?
This is where a real TikTok live view counter becomes useful. You are not watching traffic. You are reading cause and effect.
Step 4: Connect Viewer Spikes With Product List Changes
EchoTik says its live monitor can automatically extract the product list. Use this to map the live room’s product sequence.
A strong live room usually has product rhythm:
Warm-up product
High-attention product
Main conversion product
Bundle or add-on product
Trust-building product
Urgency product
When you compare product order with viewer spikes and sales signals, you can see whether the competitor is selling because of the product, the pitch, the discount or the host.
Step 5: Analyze Sales Pitch and Conversion Moments
EchoTik publicly states that it can automatically record and extract sales pitch, then cross-analyze pitch, traffic and sales.
This is the most valuable layer.
You want to know:
Which phrase made viewers stay?
Which objection did the host answer?
When did the host mention discount, stock or shipping?
Did the host repeat one message before sales increased?
Did Q&A moments drive stronger conversion than scripted pitches?
For live commerce, words matter. A weak product can sometimes perform when the pitch is clear. A strong product can fail when the pitch is confusing.
Step 6: Compare Multiple Competitor Sessions
One live session can be misleading. A competitor may have one lucky traffic spike.
Track several May 2026 sessions and compare:
Same product, different hosts
Same host, different products
Same product, different time slots
Same category, different shops
Same traffic level, different sales result
This is how you find repeatable strategy instead of chasing noise.
How to Turn Competitor Live Data Into Your Own Strategy
Build a Product Shortlist
If a competitor’s product repeatedly appears during high-viewer and high-sales moments, add it to your product research list. Then validate it with EchoTik product and category data before sourcing.
Rewrite the Live Script
Do not copy the competitor’s words. Extract the structure.
For example:
Opening hook
Problem demonstration
Product reveal
Proof moment
Objection handling
Offer explanation
Urgency cue
CTA
Then write your own version for your product, market and host personality.
Improve Your Product Sequence
Many live rooms fail because the product order is random.
Use competitor data to decide:
Which product should open the session
Which product should be saved for traffic peaks
Which product needs longer explanation
Which product works as a bundle
Which product should be repeated later
Match Products With the Right Creator
If a competitor’s live room performs well because the host explains the product clearly, do not assume the product alone is the winner.
Use EchoTik creator and influencer data to find hosts with similar audience fit, category experience and engagement quality.
Why EchoTik Is Stronger Than a Basic Live Counter
A basic TikTok live view counter shows attention.
EchoTik helps explain attention.
That difference matters.
A seller does not need to know only that a competitor reached peak viewers. A seller needs to know what created the peak, which product was shown, what pitch was used, whether sales moved, and whether the pattern repeated.
EchoTik connects live traffic, product data, sales signals, GMV estimates, creator data and broader TikTok Shop market trends. That makes it a better fit for sellers, brands, agencies and live-commerce teams that want decisions, not screenshots.
FAQ
What is a TikTok live view counter?
A TikTok live view counter tracks how many viewers are watching a TikTok live stream. Advanced tools can also track peak viewers, total viewers, follower growth, products, sales signals and GMV estimates.
Can I track competitor TikTok live GMV?
With tools like EchoTik, sellers can monitor public live-room signals and estimate sales volume and GMV based on big data. Treat third-party GMV as market intelligence, not official accounting data.
Why is peak viewer count not enough?
Peak viewers show the highest attention moment, but not whether the room converted. You also need product list, pitch timing, sales signals, follower growth and audience behavior.
How does EchoTik Live Monitor help?
EchoTik Live Monitor collects minute-by-minute live data, extracts product lists, records sales pitch, calculates sales volume and GMV based on big data, and cross-analyzes pitch, traffic and sales.
What data should I collect from competitor live rooms?
Collect live date, duration, total viewers, peak viewers, follower growth, product list, product order, sales pitch timestamps, traffic spikes, estimated sales volume, estimated GMV and top-performing product moments.