Why Are My TikTok Shop Sales Down? 7 Problems to Check

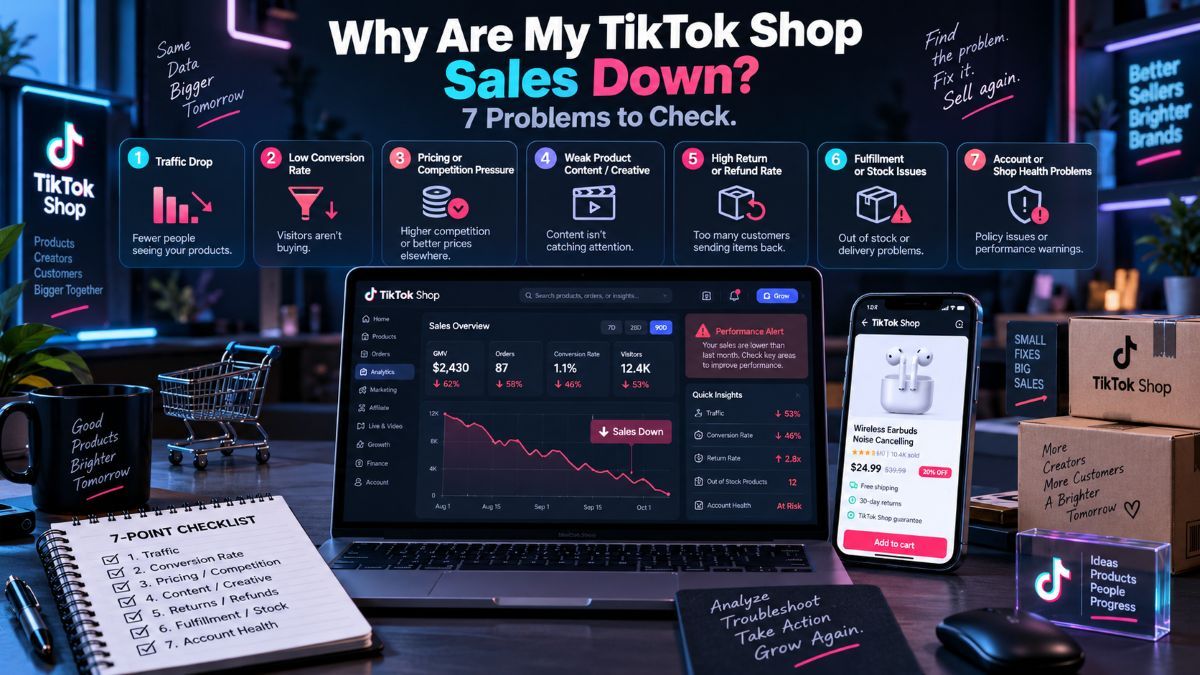
Why Are My TikTok Shop Sales Down?
TikTok Shop sales usually fall because something changed in traffic, conversion, pricing, creator activity, product demand, inventory, or shop performance.
Start with the last seven days versus the seven days before that. If impressions and product visits fell, look at content, creators, search visibility, and category demand. If traffic held steady but orders dropped, the problem is more likely the product page, price, reviews, delivery promise, or buyer trust.
Do not change five things at once. First find the part of the sales path that moved.
First, make sure the drop is real
Sales can look down because the comparison is off.
Compare the same number of days. Use the same country, currency, order status, and product group. A seven-day period should be compared with the previous seven days, not with an entire month that included a campaign or a holiday.
Also check whether the earlier period had an unusual boost.
Maybe one creator posted a video that went viral. Maybe you ran a coupon that is no longer active. Maybe TikTok had a category campaign that sent traffic to the product. Those are not normal baseline sales, so losing them is not always the same as losing demand.
It also helps to separate canceled and refunded orders from paid-order activity. A product can still get the same number of orders while net revenue falls because more customers are canceling or returning it.
Before worrying about a recovery plan, make sure you are comparing like for like.
Is this a traffic problem or a conversion problem?
This is usually the fastest way to narrow things down.
What changed | Where to look first |
|---|---|
Impressions and clicks both fell | Content output, creator activity, search placement, category demand |
Impressions stayed steady but clicks fell | Video hook, main image, title, price, offer |
Clicks stayed steady but orders fell | Product page, reviews, delivery, variants, trust |
Orders stayed steady but GMV fell | Discounting, lower average order value, bundle changes |
GMV stayed steady but profit fell | Commission, ad spend, shipping, refunds |
One SKU dropped | Product lifecycle, pricing, stock, competition |
Most SKUs dropped together | Shop traffic, account health, fulfillment, campaign changes |
A traffic decline means fewer shoppers are reaching the product. A conversion decline means shoppers are still arriving but deciding not to buy.
Those two problems need different fixes.
If your views are down, adding another product-page image will not solve much. If people are clicking but not buying, posting more videos may only send more traffic into the same weak listing.
Check what changed around the product
A product can lose sales even when your shop is doing everything right.
Demand may be cooling. A seasonal use case may be over. A newer version may have entered the market. Shoppers may have seen the same product too many times and moved on.
Look at the product over two windows: the last seven days and the last 30 days.
If the product is slipping in both periods, that is more meaningful than one slow weekend. If sales are down only during the past week, look for a recent event: a price increase, a stock issue, a creator pause, a negative review spike, or a competing offer.
Then look outside your own shop.
Are similar products now cheaper? Did a competitor launch a bundle? Are more sellers using the same creator angle? Did a new product solve the same problem better?
You do not need to copy every competitor move. In fact, copying their coupon or bundle without checking your margin is usually how a sales dip turns into a profit problem.
What you are looking for is the reason a shopper would choose another listing today.
To compare product demand, shop activity, creators, and market movement, explore the TikTok Shop data dashboard.
Sometimes the product did not get worse—the offer did
A product can stay the same while its offer becomes less appealing.
Maybe your $29.99 item was competitive last month because you had free shipping and a 10% coupon. Now the coupon is gone and competing shops are at $24.99. Maybe your product still has a good margin, but buyers do not see enough reason to choose it over a similar listing.
Check the real checkout offer, not just the list price.
Look at:
Product price after seller-funded discounts
Shipping cost and delivery estimate
Bundles and multi-buy offers
Current ratings and recent review language
Stock on the most popular color, size, or variant
Whether the main image still matches what customers see in creator videos
A missing best-selling variant can quietly hurt conversion. The product is technically in stock, but the option buyers came for is unavailable.
The same thing happens when a creator video shows a larger bundle or a different color than the version most customers land on. People click because the video looks good, then leave because the listing does not match what they expected.
Open the traffic-source reports
Total sales do not tell you which part of the shop slowed down.
Break the drop apart by source: seller videos, affiliate videos, LIVE, Shop Tab, search, paid ads, and repeat buyers. You may find that overall GMV fell because one source disappeared while the rest of the shop is fine.
A common example: seller videos keep getting views, but affiliate creator orders fall. That often means creators stopped posting, moved to another product, or no longer have a reason to keep promoting yours.
Another: Shop Tab traffic falls while video traffic stays steady. In that case, look at product-page quality, stock, reviews, price competitiveness, and whether the listing is still eligible for recommendation or campaign traffic.
For creator traffic, check the recent posting pattern before you change commission rates.
How many creators published in the last seven days? Which ones drove product clicks? Did their orders fall because views dropped, or did people stop converting after the click? Are sales concentrated in one creator who has not posted lately?
If a single creator has been responsible for most of the product’s sales, a quiet week from that person can make the shop look like it has a major demand problem. It may simply have a creator-dependency problem.
Watch the product page after you watch the video
When traffic is steady and orders decline, the product page deserves attention.
Read the newest reviews first. They are usually more useful than the average rating. Look for repeated phrases: “smaller than expected,” “didn’t work,” “wrong color,” “took too long,” “missing part,” or “not like the video.”
Those comments tell you where the buyer lost confidence.
A few negative reviews are normal. A new pattern is different. If several customers mention the same issue, check the exact SKU, supplier batch, warehouse, and creator content tied to those orders.
Product descriptions also age faster than sellers expect. You may have added new variants, changed packaging, adjusted a bundle, or switched a supplier. If the page still describes the old product, customers notice.
For a deeper look at how product visits become orders, read our TikTok Shop conversion funnel guide.
Do not ignore inventory and shop health
Some sales drops are operational.
Check whether any key SKU is low on stock. Check whether fulfillment time changed. Check cancelations, late dispatch, refunds, return reasons, and customer-service response time.
A shop can have a good product and still lose momentum after a bad fulfillment stretch.
TikTok Shop’s Shop Performance Score brings together signals related to product satisfaction, logistics, and customer service. If your score or a related metric dropped, open the detail view instead of guessing. The issue may be a cluster of late orders, a higher refund rate, or a rise in seller-fault cancellations.
NBFR is worth checking here too. If returns or refunds are increasing because products are damaged, missing parts, late, or not as described, buyers are not the only problem. The shop is losing money and giving future customers more reasons not to trust the listing.
Do not wait for the overall score to become a crisis. A sudden rise in one return reason is enough to investigate.
You may need better data, not more dashboards
Use your own Seller Center reports for actual orders, refunds, traffic, stock, and shop performance.
Use Ads Manager to check whether paid traffic or attributed revenue changed. Use affiliate reporting to see whether creators stopped posting, changed product focus, or started sending lower-quality traffic.
Third-party platforms are most helpful when you need market context. They can help you see competitor pricing, category movement, active creators, and products that are gaining or losing attention outside your own shop.
If you need to combine native account metrics with competitor and market research, compare the best TikTok analytics tools for different use cases.
The goal is not to add another report to your week. It is to get enough evidence to make one sensible change.
A seven-day recovery plan
Day 1: Find the date the decline started. Compare the latest seven days with the seven days before, then identify which product and traffic source moved first.
Day 2: Separate traffic from conversion. Check impressions, product clicks, orders, GMV, and average selling price for the affected product.
Day 3: Review the market. Look at competing prices, bundles, coupons, new reviews, creator activity, and substitute products.
Day 4: Review creator output. Find out whether your strongest creators posted less, shifted products, or brought traffic that stopped converting.
Day 5: Fix the clearest product-page issue. That may be a weak main image, a missing product detail, an outdated variant photo, a confusing title, or an unrealistic delivery promise.
Day 6: Test one change. Publish a new content angle, give a proven creator a clearer brief, refresh the offer, or improve the listing. Keep the test narrow enough that you can understand the result.
Day 7: Compare the new data with Day 1. Keep what helped. If nothing moved, return to the next likely cause instead of repeating the same test.
You may not recover all sales in a week. But you should know much more clearly whether the issue is demand, traffic, conversion, competition, or operations.
Frequently asked questions
Why did my TikTok Shop sales suddenly drop?
A sudden drop often follows a change in creator activity, product traffic, pricing, stock, a campaign ending, or product conversion. Compare the affected period with the previous one to see whether impressions, clicks, orders, or average order value moved first.
Can low inventory reduce TikTok Shop sales?
Yes. If a popular SKU, size, color, or bundle runs low or goes out of stock, shoppers may leave even if the main listing still appears available. Low stock can also make it harder to support a successful creator or campaign.
Why are product views stable but orders declining?
That usually points to a conversion problem. Review the price, discounts, shipping estimate, recent reviews, product images, product description, and the gap between what the creator video promised and what the listing actually offers.
How long should I wait after making a change?
Give the change enough traffic to produce a useful signal. A listing update may show movement quickly if traffic is already steady. A creator or content test can take longer. Avoid changing the price, images, offer, and creator plan all on the same day, or you will not know which one mattered.