TikTok Video Analytics

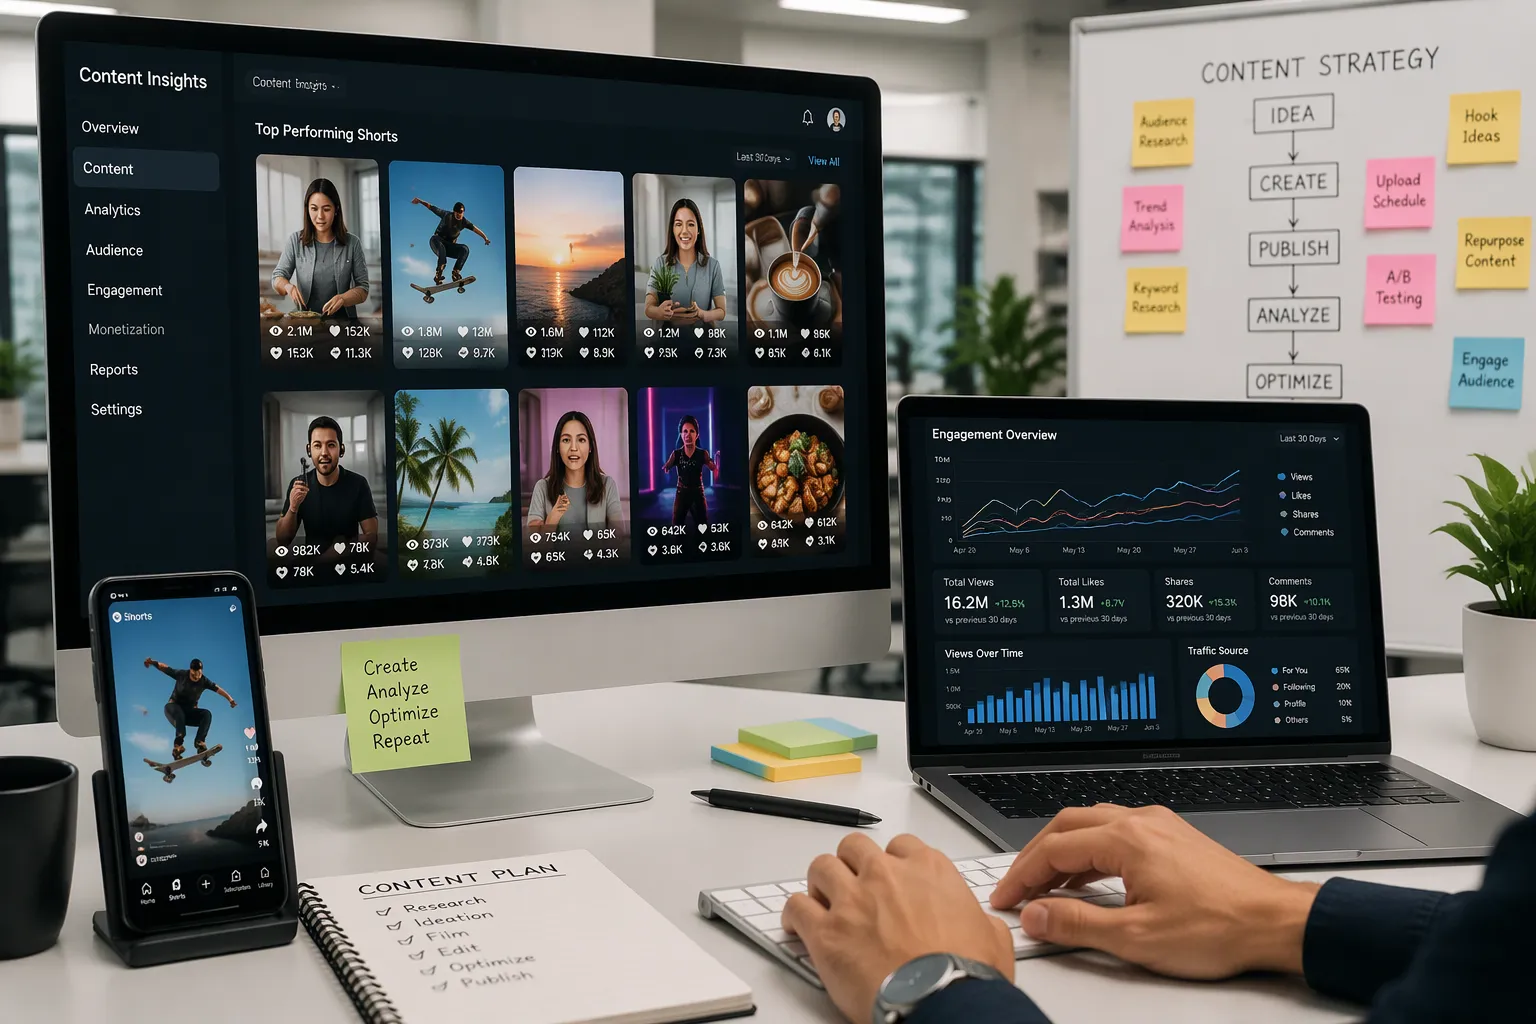
TikTok Video Analytics are the numbers behind every post you publish. They show how many people watched, how long they stayed, and how they reacted. These numbers matter because they replace guessing with smart choices. Creators, marketers, and small business owners all ask the same question: what really works on this platform? The data gives you a clear answer. You can see which clips hold attention and which ones lose viewers early. You can learn when your audience scrolls and when they engage. That knowledge shapes better content, smarter posting habits, and marketing results you can measure. You stop hoping a video performs and start understanding why it did.
Key Takeaways
Keep track of views, watch time, engagement, and demographics to learn what works on TikTok.
Use TikTok's built-in analytics for quick checks, and use third-party tools for deeper insights.
Compare your engagement rate with others in your industry to set goals you can actually reach.
Try different hooks, video lengths, and posting times to get better results.
Check your analytics every week and tweak your plan for steady growth.
TikTok Video Analytics: Key Metrics
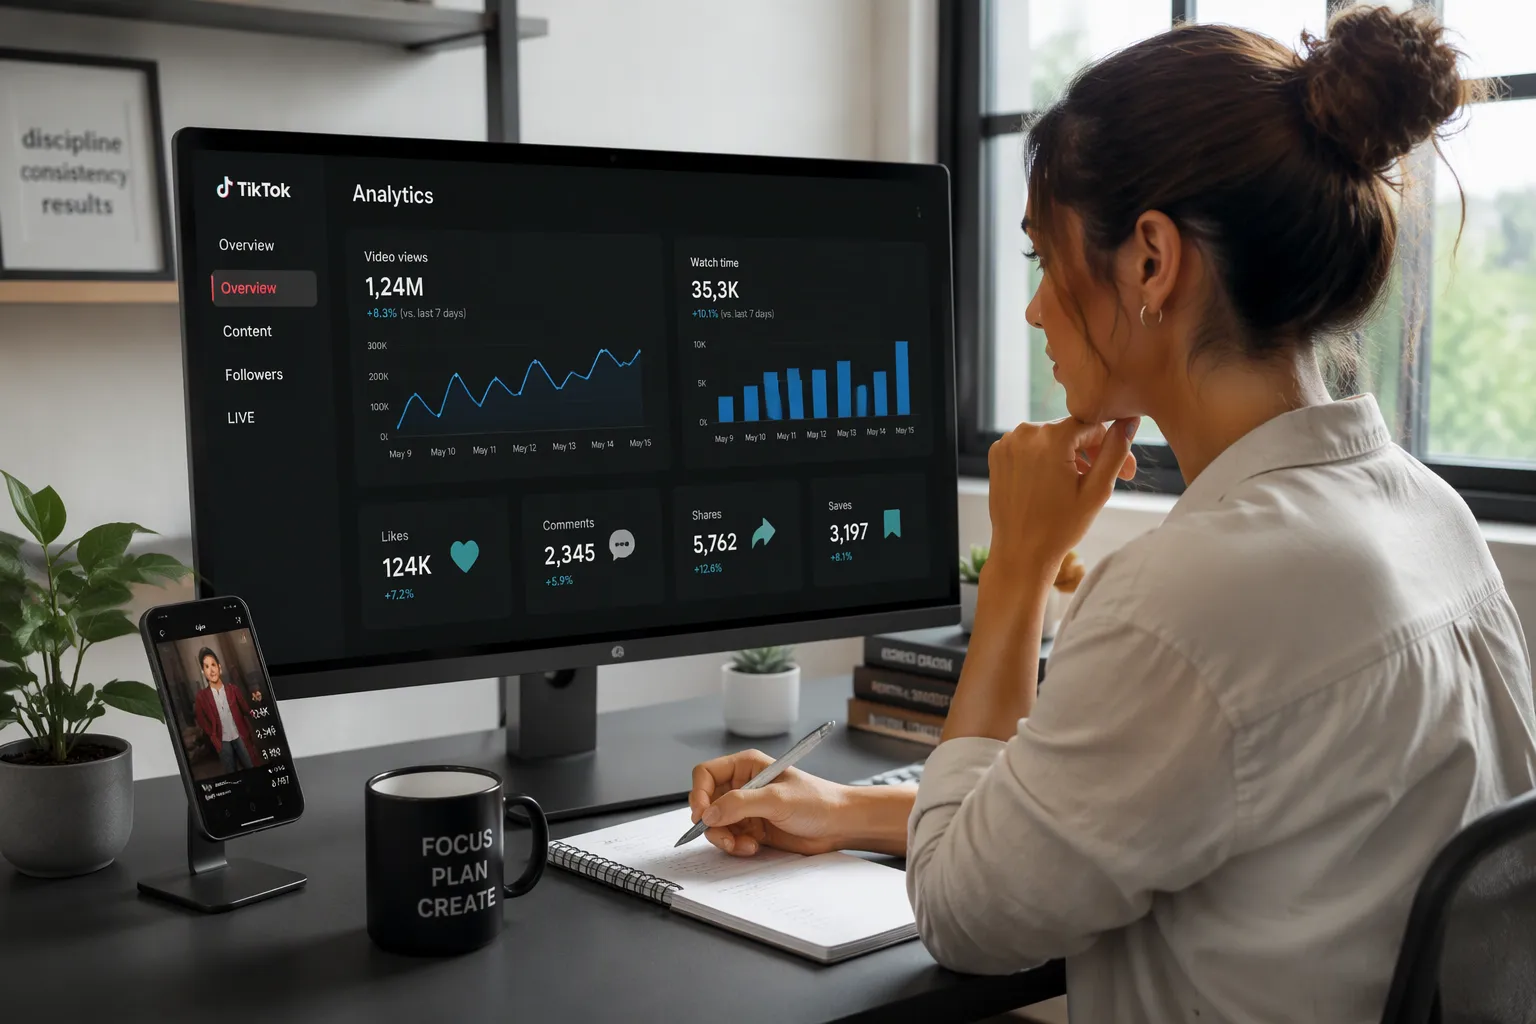
TikTok Video Analytics split into a few main numbers. Each one answers a different question about your content. Learn what each metric means, and you can read any video's story quickly.
Views and Watch Time
Views count the total number of times people played your videos in a chosen period. AdsMurai lists this figure alongside profile visits, likes, comments, shares, and follower growth. The same dashboard shows your content count and live video count for the selected dates. Views alone tell you reach, not quality. Watch time tells you whether viewers stayed.
Average watch time equals total watch duration divided by the number of views, according to Ignite Visibility. That calculation includes multiple replays, partial views, and drop-offs after the first few seconds. You find it under Creator Tools, then Analytics, then Content, by opening any video. Total playback time and average viewing time sit beside these figures. Ignite Visibility reports that average watch time per video runs 15 to 30 seconds. The most successful TikTokkers hit a 70-80% completion benchmark on short clips. Videos over a minute land at 50-70%. Ignite Visibility suggests a starting goal of 50%, the midpoint.
Views also split by source. AdsMurai notes that traffic can come from the For You feed, your profile, the Following feed, audios, searches, and hashtags. A clip that draws most views from search behaves differently from one fed by the For You page. Region data shows your top user locations. Complete views and audience reached round out the picture.
Engagement and Demographics
Engagement covers likes, comments, shares, and saves. Lyfe Marketing tracks these signals plus unique viewers. Comments show conversation, and shares extend your reach to new viewers. Saves matter because they show strong intent. A viewer who saves your clip plans to return to it.
Demographics show who watches. Buffer explains that the Followers tab reveals age, gender, top territories, and the hours your followers are online. Business accounts see extra insights, including traffic sources and audience retention. Follower activity hours tell you when to post for the best chance of early views. Use this data to match your posting schedule to real audience habits.
Engagement rates vary by industry. Rival IQ reports a median engagement rate by follower of 1.73% across TikTok. The median by view is 3.4%. Higher Ed leads industries at 7.36%, followed by Nonprofits at 3.04%, Travel at 2.73%, Sports Teams at 2.68%, and Food and Beverage at 2.04%. The top quarter of schools earn a little over 19%, more than double the Higher Ed median.
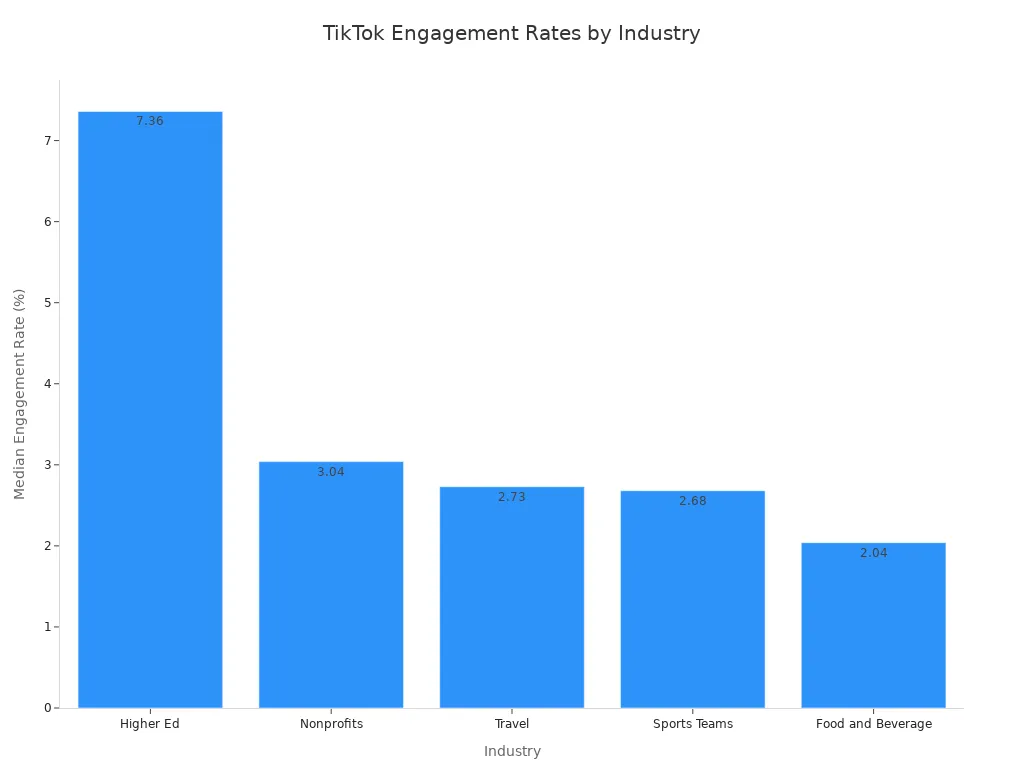
Compare your own rate against your industry, not the platform average. A 2% rate looks weak next to Higher Ed and strong next to Food and Beverage. TikTok Video Analytics reward context. Track views, watch time, engagement, and demographics together, and you see the full picture of any post.
Accessing Your Analytics
You have two main ways to get your numbers: TikTok's own dashboard and outside tools. Each way works best for a different job.
Built-In Tools
The built-in Analytics section shows video views, likes, comments, shares, and profile views for a time period you pick. Views show up as totals plus percent changes. Hootsuite explains the mobile steps:
Tap Profile.
Tap Menu.
Tap TikTok Studio for a personal account, or Business Suite for a business account.
Tap Analytics.
On desktop, log in at studio.tiktok.com and click Analytics in the left sidebar. For one video, open the three-dot menu on the post and choose Analytics.
The built-in tool has limits. Coupler.io reports that the View Analytics section only lets you download the past 60 days, and older data can no longer be reached. TikTok's own dashboard also has no direct export feature, according to Sprout Social. Export important reports on a regular schedule instead of waiting until you need them.
Third-Party Platforms
Free outside tools can analyze any public account without a login. They show view trends, engagement rate, top videos, and best posting times. Each platform fits a different use case. Buffer suits solo creators who run a few accounts, with basic performance metrics and best-time-to-post tips. SocialPilot fits agencies that handle many client accounts from one dashboard. Iconosquare serves visual-first brands focused on short-form video, with viewer retention data. Audiense helps strategists build audience segments before a campaign.
Other TikTok Video Analytics platforms cover narrower jobs. Soundcharts offers real-time analytics for more than 20 million artists. Buzzlytics checks any account's views, followers, and engagement rate and builds live branded dashboards. MaveKite analyzes a profile, video, song, hashtag, or keyword, tracks daily growth, and exports CSV or PDF files. Socialinsider runs a free TikTok audit with engagement rate, posting frequency, average likes and comments, and top videos from the last 30 days. Vidio.ai scores any public video and compares it with the creator's latest videos. Sprout Social rounds up 14 TikTok analytics tools for a wider survey.
Comparing Your Options
Performance and Fit
How fresh the data is sets the two paths apart. TikTok's own analytics updates numbers about every 4-6 hours, according to Echotik, and view counts on popular videos refresh every few hours. Third-party tools pull from public scrapers or official connection points, and official rate limits cap how fast they gather stats. Echotik notes that personal accounts face tighter request limits than business pages. Check the real sync frequency before you trust a "real-time" label. Dashboardly warns that some dashboards show data delayed by 24-48 hours.
The right fit depends on your job. The built-in dashboard works well for quick checks on your own profile. Third-party platforms work well for tracking across accounts or platforms. Dashboardly advises agencies to require multi-shop views, client-ready reporting, and clean export workflows. For TikTok Shop sellers, direct API connections beat scraping or manual imports.
Aspect | Built-in analytics | Third-party tools |
|---|---|---|
Data freshness | Updates every 4-6 hours | Varies; verify sync frequency |
Historical retention | 60-90 days | Varies by plan |
Account coverage | Your profile only | Any public account |
Best fit | Quick personal checks | Cross-account tracking |
Compliance and Cost
Compliance should be part of your comparison. If you work in the EU or UK, you need valid consent before collecting personal data through TikTok pixels, per WebToffee. Heydata.eu notes fines of up to 4% of global annual revenue are possible for unlawful data transfers. Improvado suggests testing a Data Subject Access Request with your vendor before an audit and writing down your tool choice.
Cost varies a lot. Metricool offers a free plan for one profile and paid plans starting at $22 per month, per Echotik. Buffer starts at $6 per channel monthly. Socialinsider starts at $99 monthly, and Sprout Social starts at $199 per seat monthly. The built-in dashboard costs nothing. Match the price to the job: a free tier covers basic tracking, and a paid tier pays off when you need competitor benchmarking or client reports.
Using TikTok Video Analytics for Insights
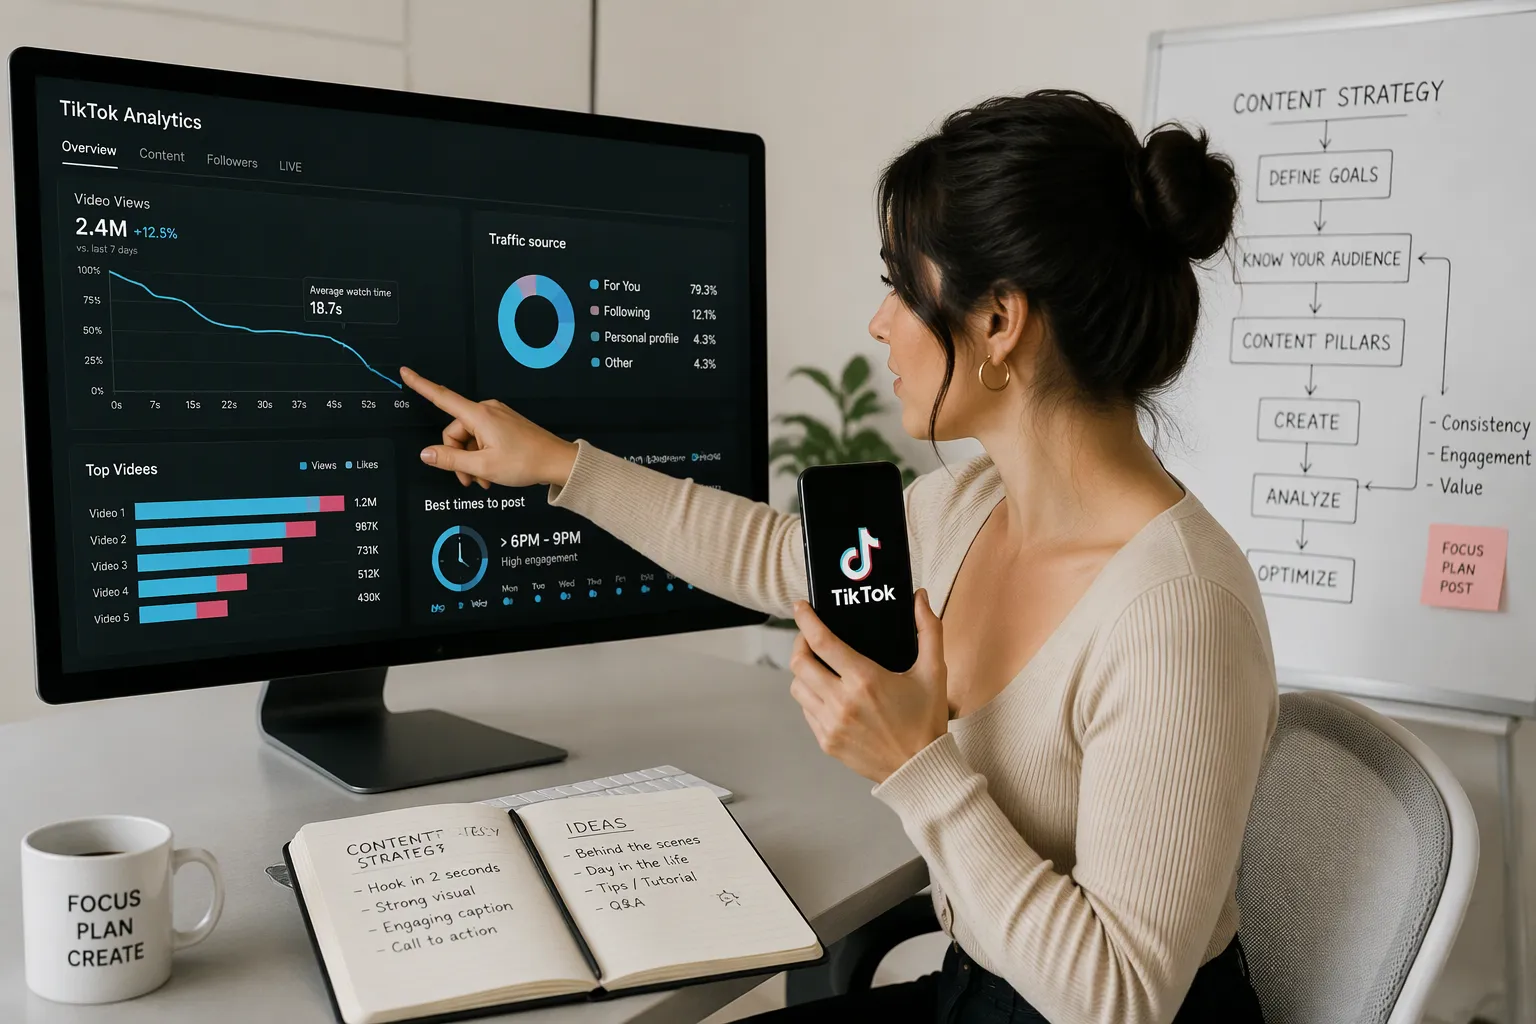
Numbers only help when you look at them together. One view count by itself does not tell you much. Patterns over several weeks show you what to repeat and what to stop doing.
Spotting Trends
Begin with audience retention. The analytics graph shows the exact moment viewers scroll away. Those dips point to weak spots in your video. InfluenceFlow calls this your clearest sign for fixing future clips. Check watch time every week. If watch time goes up, your content is getting better. If watch time goes down, interest is fading.
Also watch for sudden drops in engagement. InfluenceFlow reports that creators who found drops of 30% or more and recovered within two weeks kept their partnership pipeline intact. Put your top videos side by side and compare them. Swydo advises studying the themes, formats, and storytelling methods that win. A video with high views but low engagement needs a closer look. Ask whether the content really fits your audience and whether a clear call to action appears.
Posting-time data works the same way. Open TikTok Analytics, go to the Followers tab, and check Most active times, per Buffer. That view shows when your followers were online in the past week. Give each time slot a few weeks before you judge it. Buffer recommends testing new times every few weeks as trends shift. Sprout Social puts it plainly:
Global datasets and industry benchmarks provide a powerful, data-backed foundation for your strategy. But to dominate the algorithm, individual audience data is king. The best time to post on TikTok is when your unique followers are online, engaged and ready to act.
Optimizing Content and ROI
Turn insights into small changes you can test. Uplifted reports that 71% of users decide whether to keep watching within the first three seconds. Test at least three different hooks per campaign and check which one holds viewers past that mark. Radaar finds that videos between 15 and 30 seconds capture the most attention, while longer formats need a strong hook to work. Change scenes, angles, or topics every 5 to 10 seconds to keep pacing fast, as InfluenceFlow suggests. Do a weekly review instead of waiting for month-end.
Connect content to money with tracking. Add UTM parameters to every link. A UTM parameter is a short tag added to a URL that tells your analytics tool which post sent the click. Give each creator a unique link or promo code, then track clicks, conversion rate, and revenue, per Bitly. Improvado offers a simple ROI formula: (value of social conversions minus marketing costs) divided by marketing costs. Costs include ad spend, tool subscriptions, and management time.
One influencer campaign tracked through TikTok Video Analytics shows the payoff. It generated $487K in sales on $78K in cost, a 6.24:1 return. After mid-campaign optimization, conversion rate rose from 4.2% to 7.8% and return climbed to 8.1:1, per InfluenceFlow. Posts between 7 and 9 PM on weekdays drove 2.3 times more conversions, and creators with 100K to 300K followers outperformed other tiers.
Metric | Result |
|---|---|
Sales generated | $487K in 24 weeks |
Campaign cost | $78K |
ROAS | 6.24:1 |
ROAS after optimization | 8.1:1 |
You now have the full picture. Know your metrics, pick the access method that fits your workflow, and act on what the numbers tell you. TikTok Video Analytics turn raw counts into clear next steps. Treat this work as a habit, not a one-time check. Review your dashboard each week, compare new posts against old winners, and adjust your hooks, length, and posting times as patterns emerge. Small, steady tweaks compound into real growth. Encouraging results start with one honest look at the data. So open your analytics dashboard today. Pick one insight, apply it to your next video, and watch what changes.
FAQ
How often does TikTok update view counts?
TikTok's own dashboard refreshes numbers roughly every 4-6 hours. Popular videos can update a little faster. Check the timestamp before you panic about a flat line. Third-party tools vary widely, so confirm their sync speed before you trust a "real-time" label.
What counts as a good engagement rate on TikTok?
Rival IQ puts the median at 1.73% by follower and 3.4% by view. Judge your number against your industry instead. Higher Ed leads at 7.36%, and Food and Beverage sits at 2.04%. A rate that looks weak platform-wide may beat your own niche.
How far back can I see my TikTok analytics?
The built-in View Analytics section only lets you download the past 60 days. Older data becomes unreachable. Export important reports on a regular schedule. Waiting until you need historical numbers rarely works in your favor.
Why did my views drop even though my watch time stayed high?
High watch time with falling views usually means a reach problem, not a content problem. Check your traffic sources. A clip fed by search behaves differently from one carried by the For You feed. Adjust your hashtags and posting times, then test again.
Do I need a paid tool to track competitors?
No. Free tools like Socialinsider and Vidio.ai analyze any public account without a login. Paid plans start around $6 per channel monthly at Buffer and $22 monthly at Metricool. Upgrade only when you need client reports or deeper benchmarking.
See Also
Essential TikTok Analytics Tool For Tracking Your Performance
How To Get TikTok Analytics For Better Content Strategy
How To Get Analytics On TikTok And Improve Results