What TikTok Live Analytics Are and How to Use Them

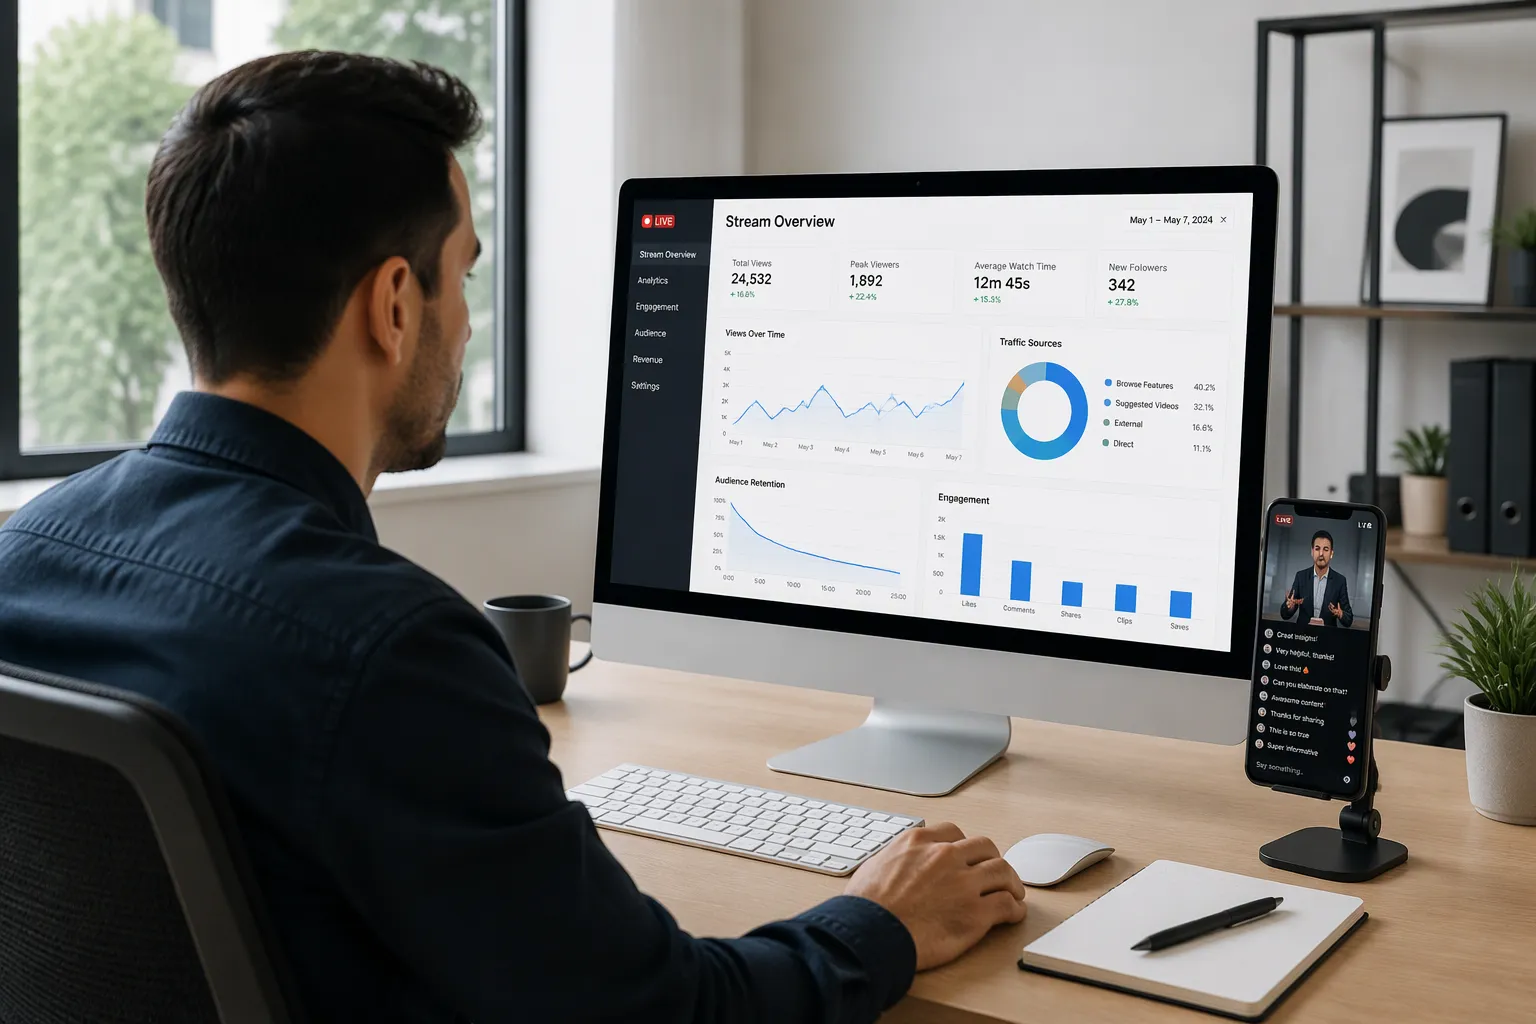
TikTok Live Analytics is the built-in dashboard that tracks how your live streams performed. It records what happened during each broadcast and turns that activity into numbers you can review afterward.
The purpose is simple. It shows what worked and what didn't, so you can improve the next stream. You do not have to guess why one broadcast drew a crowd and another fell flat. The dashboard holds the answer.
You will learn the key metrics, how to find them in Creator Tools, and what to do with the numbers once you have them. Each step builds on the last, and each one gives you something concrete to act on.
Key Takeaways
TikTok Live Analytics shows what worked in your live streams and what didn't.
Focus on Average Watch Duration and Unique Viewers to measure real engagement.
Find your analytics in Creator Tools, then Analytics, then LIVE Analytics.
Compare your engagement rate to benchmarks for your follower tier.
Test one change at a time and review your analytics weekly to improve.
TikTok Live Analytics: Key Metrics
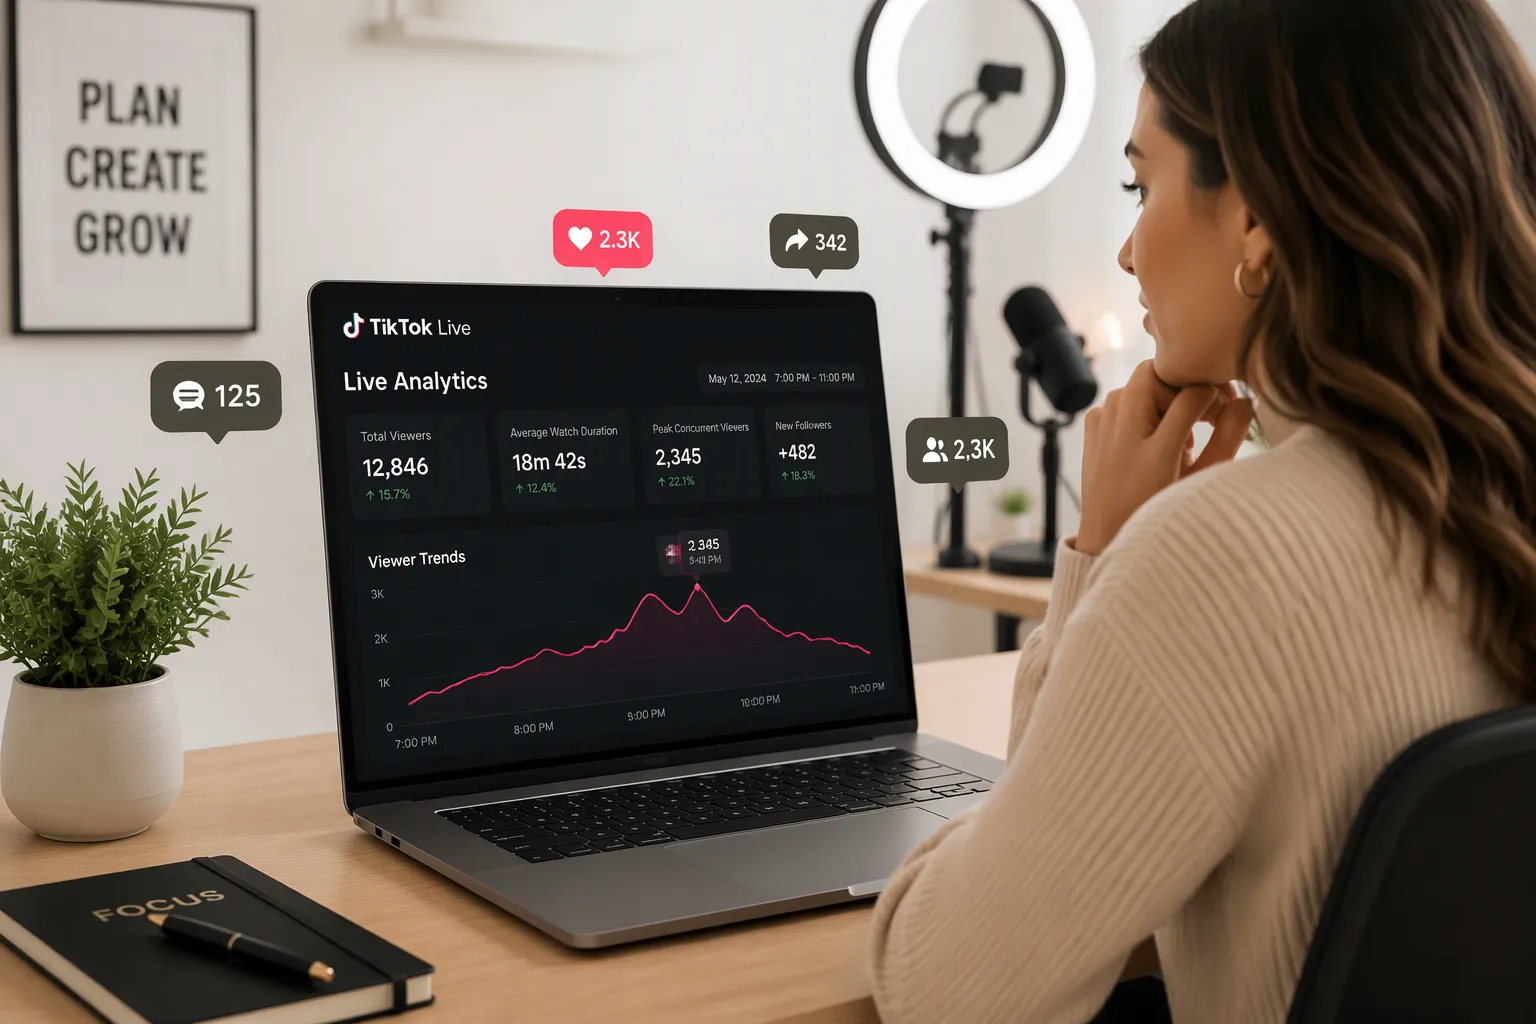
TikTok Live Analytics organizes your data into two tabs: Overview and Video analysis. The Overview tab gives you the big picture for a selected period. Video analysis breaks down individual streams. Both tabs feed the same goal: separating numbers that look impressive from numbers that actually tell you something.
Viewer and Watch Metrics
Total Viewers is the first number most creators check. Treat it as a vanity metric. It counts every view, including people who left after a few seconds. A large total can hide a weak stream. The same caution applies to likes. TikTok viewers may tap repeatedly, so likes are an activity signal, not a count of unique engaged people.
Core watch metrics tell a truer story. Average Watch Duration shows how long viewers stayed on average. Peak Concurrent Viewers is the headline stat for momentum — the highest number of people watching at one time, per TikTok's Seller University. Average Concurrent Viewers smooths that spike into a typical session size. Unique Viewers counts each person once, no matter how many times they joined, according to Rival IQ. Total Views covers all views in your selected period, which can run 7, 28, or 60 days, or a custom range.
Metric | What it measures |
|---|---|
Total Views | All views in the selected period |
Unique Viewers | Individual people who watched at least once |
Peak Concurrent Viewers | Highest simultaneous audience |
Average Watch Duration | Typical time each viewer stayed |
Compare peak against average. A wide gap means your audience spiked and thinned. Negative responses, such as dislikes or complaints, flag potential issues early. A rising count deserves a look at what you said or showed.
Engagement and Growth Metrics
Engagement quality matters more than raw counts. Comments show conversation volume. Shares signal that a viewer thought someone else would find the stream relevant. Saves mean someone plans to return. Emplifi notes that comment threads reveal real sentiment, and shares with commentary carry a personal endorsement.
Normalize engagement against reach. Comments per 100 viewers equals comments divided by unique viewers times 100. Share rate uses the same denominator. One person may write many comments, so label the figure comments per 100 viewers, not a unique comment rate. Follower conversion equals new followers divided by unique viewers times 100. TikTok Stats illustrates the point: a stream with 140 new followers from 7,000 unique viewers converts at 2.0%, while 80 from 10,000 converts at 0.8%. The smaller stream grew its channel more efficiently. A weak rate can mean the content was a one-time draw with no reason to return.
True engagement rate equals total engagements divided by actual reach times 100. Emplifi's example: a post reaching 40,000 people with 1,200 engagements earns a 3% rate. Gifter conversion follows the same pattern — gifters divided by unique viewers times 100 — and shows how broadly viewer support spread.
Gifts and new followers are your growth signals. Diamonds, TikTok's virtual gift currency for eligible creators, convert to revenue. New followers show whether viewers want more from you. Watch both alongside reach, not in isolation.
Accessing Your TikTok Live Analytics
Navigating Creator Tools
You can reach your TikTok Live Analytics dashboard in a few taps on the mobile app. Emplifi lays out the path clearly:
Open the TikTok app and tap the Profile icon in the bottom right corner.
Tap the menu icon in the top right corner to open your account settings.
Select Creator tools, then tap Analytics.
Virlo describes the same route in slightly different words. From your profile, tap the three lines in the top-right corner, head into Creator Tools, and tap Analytics. Tagembed notes that Analytics splits into several categories, and Live Analytics sits among them. If you sell on TikTok Shop, you have a second door. Log in to the TikTok Shop Creator website with your mobile credentials and open LIVE Manager. During a broadcast, click the computer monitor icon in the top right corner to pop open a LIVE Board for the current stream.
Reviewing a Finished Stream
After your livestream ends, go to Analytics, then LIVE Analytics, then All LIVE videos, per TikTok's Seller University. The Overview tab shows your overall performance across a window you choose, from the last 7 days up to the last 60 days, according to TikTok's Live Studio help page. It breaks data into viewership, engagement, rewards, and activity. It also adds a viewer section covering traffic sources, country or region, age, and gender. The Video analysis tab goes stream by stream. You can filter by most recent, most Diamonds, or most viewed to see which content resonated.
Sellers get one more layer. TikTok Shop Seller Center offers LIVE Diagnosis under Analytics, then LIVE & Video, then Details. The Your Performance Insights column rates yesterday's room against your own median from the last 14 days, and the data stays available for up to 3 months. A View Diagnosis button may take time to appear while the system prepares the analysis. The Diagnosis page then lists a performance recap and the top 5 recommendations, ranked by priority across LIVE duration, impression per hour, traffic, and quality. A Learn more button covers room presentation, host enthusiasm, engagement, and basic requirements such as violations.
Reading the Numbers
What High and Low Values Mean
A number alone tells you nothing. You need a reference point. There is no universal TikTok LIVE engagement rate that every creator should reach, so judge your own rate against your own history rather than against a larger creator. Treat average watch duration qualitatively. A duration that climbs stream over stream is a good sign. A duration that falls while reach grows means new viewers leave early.
Spotting Trends Across Streams
One stream is an anecdote. A pattern across several streams is a signal. Buffer recommends zooming out from single posts and watching for themes, tones, and topics that consistently perform well. Check whether certain broadcast times get better results. Note whether your strongest streams are funny, educational, or emotional.
Review the LIVE tab metrics: total views, unique viewers, new followers, top viewer count, and diamonds.
Look for drop-off at a certain minute; the format may need tightening.
Replicate the hook or format when many new followers arrive during a live.
Test variables such as opening lines, formats, and timing.
Treat TikTok Live Analytics as an ongoing feedback loop, not a one-time check.
Sprout Social suggests a regular reporting cadence, whether monthly, quarterly, or biannually. Pick a rhythm you can keep and compare like with like.
Using Data to Improve Streams
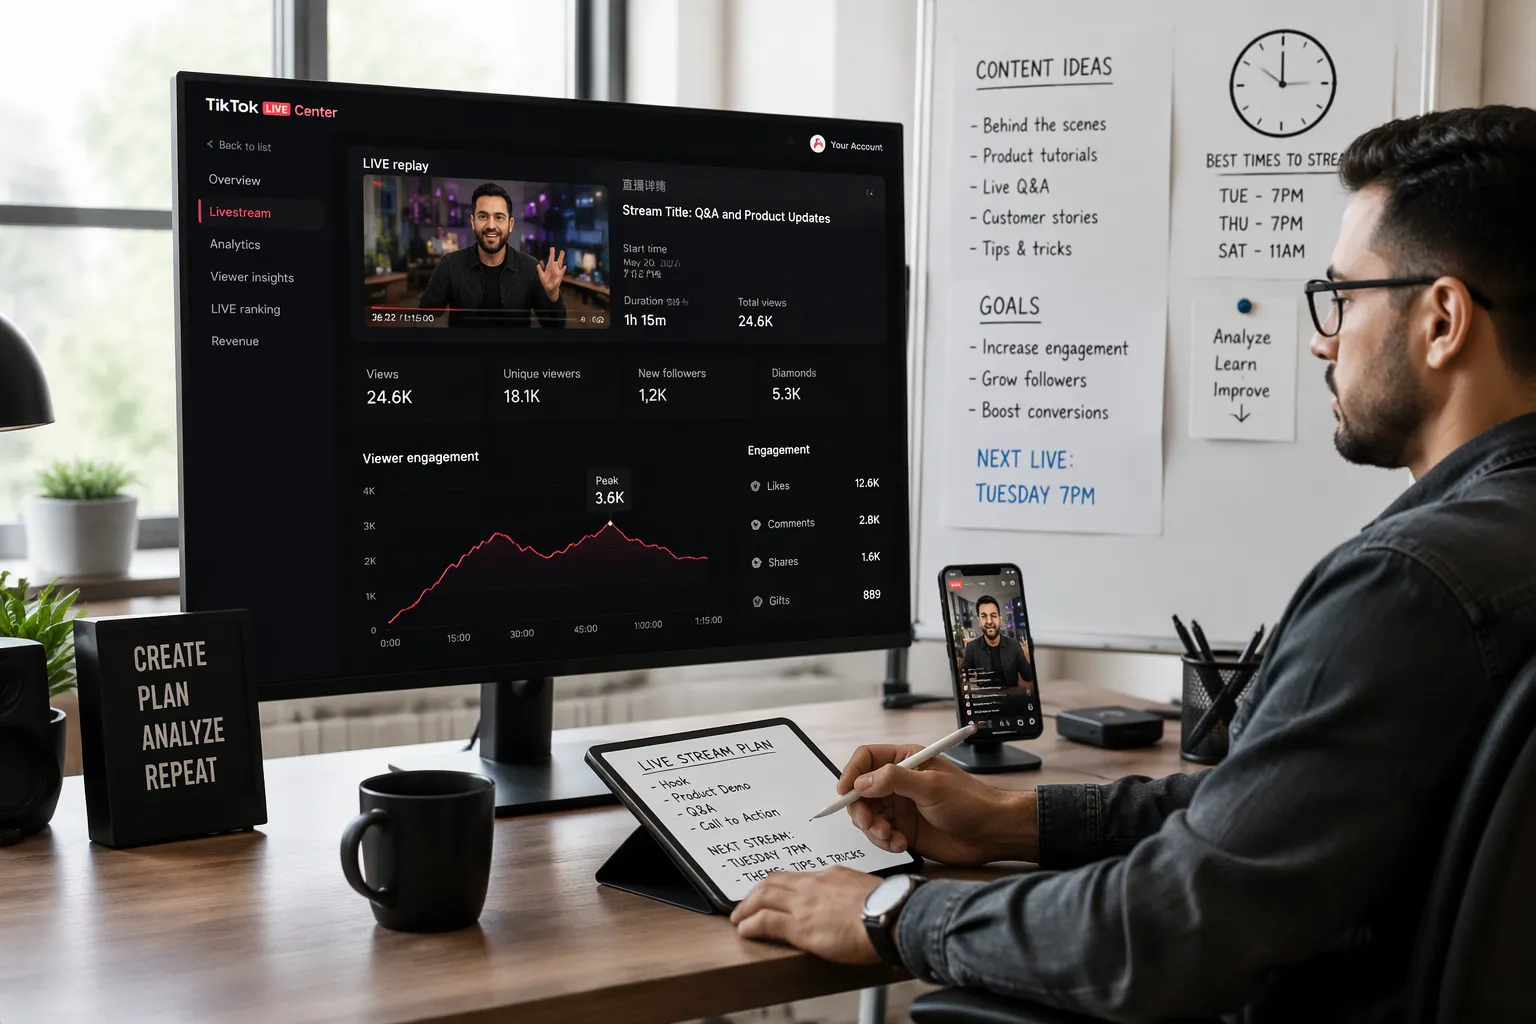
Numbers only pay off when you change something. Treat each stream as a test, and let TikTok Live Analytics tell you which test to run next.
Tuning Content, Timing, and Interaction
Start with the session itself. Advertisemint recommends three habits: respond to comments and viewer suggestions as they arrive, use polls, Q&A sessions, and challenges to lift participation, and watch the live viewer count for real-time signals about what resonates. CapCut adds a useful pattern. If viewers disengage after 10 minutes, introduce a giveaway or a topic change at that point to hold attention. Pin your key messages in the comments to keep focus.
Then review the replay. Check follower and profile-view growth after the session, the views on the replay, and the likes, comments, shares, and gifts it collected. Note the timestamps when viewers were most active. TikTok analytics often highlight your most engaging moments, per Advertisemint, so you can see exactly which segment earned the reaction.
Finally, apply what you learned:
Refine content toward the segments and topics that drew the most interaction.
Schedule future streams when your audience is most active. CapCut gives an example: if your audience peaks between 7 and 9 PM, stream in that window.
Repeat the interactive features that drove engagement, such as polls and Q&A.
Promote to the right audience using your viewer demographics.
Ignite Social reports that creators who analyze post-live analytics weekly improve engagement by 41% within 90 days. A weekly review rhythm is the habit behind that gain.
Growing Viewers and Revenue
Growth follows the same logic. CapCut advises tracking which content types attract new followers. If collaborations bring higher follower gains, partner with other creators regularly. Offer exclusive content or discount codes to viewers who follow during the stream. Bemomentiq's blog covers related ground, from live giveaways that convert to post-live strategies that turn viewers into repeat customers.
Monetization responds to data too. Live analytics reveal which streams generate the most gifts and earnings, per CapCut. If PK battles drive the most gifts, schedule more of them and reward top gifters with shoutouts. Set milestones to motivate viewers, such as a fun challenge once the stream hits a coin target.
Ignite Social ties the metrics to decisions in a compact way:
Metric | What it reveals |
|---|---|
Peak Viewership | Identifies optimal scheduling |
Gift Tracking | Shows ROI for monetization efforts |
Engagement Rates | Measure average comments per viewer |
Keep these growth moves in your rotation:
Plan and promote lives in advance, and share trailers on other platforms.
Run interactive Q&A and multi-guest sessions.
Hold a consistent live schedule.
Set engagement and gift goals clearly.
Celebrate milestones during the stream.
One caution: change one variable at a time. If you alter timing, format, and offers together, you cannot tell which one moved the number.
TikTok Live Analytics only pays off when you act on what it shows. The dashboard records the stream. Your next move turns that record into progress.
Open the Overview tab for your last stream today. Pick one change to test next time. Maybe you shift your start time, tighten the opening minutes, or add a poll at the point where viewers drift away. Test that single change and compare the results.
Small, steady adjustments add up. Each stream teaches you something, and each review makes the next broadcast stronger.
FAQ
How often should you check your live analytics?
Review them weekly. Ignite Social reports that creators who analyze post-live analytics weekly improve engagement by 41% within 90 days. A weekly rhythm lets you compare like with like and catch trends before they fade.
Which metric should you look at first?
Start with Average Watch Duration. It tells you whether viewers stayed or left early. Peak Concurrent Viewers gives you the headline number, but duration shows whether that crowd actually watched.
Does a high Total Viewers count mean your stream succeeded?
Not on its own. Total Viewers includes people who left after a few seconds. Pair it with Unique Viewers and Average Watch Duration to see how many real people stayed and for how long.
What extra data do sellers get?
Sellers can open LIVE Diagnosis in Seller Center under Analytics, then LIVE & Video, then Details. It rates yesterday's room against your own 14-day median and lists the top 5 recommendations. Data stays available for up to 3 months.
See Also
Essential TikTok Analytics Tool For Tracking Your Performance
How To Get TikTok Analytics For Better Content Strategy
How To Access And Understand Analytics On TikTok