TikTok Shop analytics guide for tracking shop performance


TikTok Shop analytics is the practice of tracking the numbers that grow your shop. Three metrics matter most: GMV, conversion rate, and creator performance. Shops that watch these numbers scale. Shops that ignore them stall.
This guide speaks to brands already testing or selling on TikTok Shop. You will learn where to find your data, which metrics deserve your attention, and how to act on them every week.
Keep one scope note in mind. TikTok Shop analytics is not the same as TikTok Ads analytics. Ads data covers your paid campaigns. Shop data covers the full picture, from creators to checkout.
Key Takeaways
Track four key numbers: GMV, conversion rate, creator ROI, and contribution margin.
Use Seller Center and Affiliate Center to find your shop data.
Compare each traffic source against its own conversion benchmark.
Review your numbers weekly and fix one metric at a time.
Aim for a contribution margin of 15–30% after all costs.
What Is TikTok Shop Analytics?

TikTok Shop analytics means systematically tracking the metrics that grow your business. It does not mean drowning in every number the platform exposes. You pick the measures that connect to revenue, then you review them on a schedule.
The scope is wider than most sellers expect. According to eva.guru, TikTok Shop analytics spans several operating surfaces: Seller Center, Shop Analytics, Product Analytics, Affiliate Center, Shop Ads, LIVE, video, orders, finance, logistics, and customer service. That range covers content, creators, affiliates, ads, catalog, fulfillment, inventory, and profit. You separate traffic, content engagement, product conversion, actual GMV, cancellations, returns, creator commissions, ad spend, platform and logistics fees, and contribution. Then you review creator-product-content combinations as cohorts and scale only the combinations that stay healthy after fulfillment and refunds.
Metrics That Grow Your Business
Not every metric deserves equal attention. Canopy Management groups them into four tiers, and the hierarchy keeps you focused on numbers that move the needle rather than numbers that look impressive in reports.
Tier | Category | Metrics | Business Impact |
|---|---|---|---|
Tier 1 (Critical) | Revenue and profitability | GMV, Conversion Rate by Traffic Source, ROAS, AOV | Directly impact P&L |
Tier 2 (Strategic) | Customer | CAC, CLV, Repeat Purchase Rate, New-to-Brand Percentage | Predict long-term value |
Tier 3 (Tactical) | Content performance | Views-to-Click Rate, Click-to-Purchase Rate, Save Rate, LIVE Shopping Analytics, Creator Performance | Drive discovery |
Tier 4 (Operational) | Efficiency | Shop Performance Score (SPS), Fulfillment Metrics, Customer Service Excellence | Support sustainable growth |
Start with Tier 1. Revenue and profitability metrics tell you whether the shop works. Tier 2 metrics then tell you whether it will keep working.
Shop Analytics Vs. Ads Analytics
These are two separate systems, and mixing them up distorts your picture. Dataslayer explains the split clearly. TikTok Shop analytics track sales from your storefront, including video, in-app shop, live, and affiliate-driven purchases. TikTok Ads analytics measure paid campaign performance: impressions, clicks, and pixel or Events API conversion events.
Use both together to calculate blended ROAS. Shop data tells you what happened after discovery. Ads data tells you what you paid to create that discovery. Keep paid results separate from organic performance until you intentionally combine them. TikTok also notes that Seller Center and Ads Manager metrics may differ, so match every report to its attribution setting and date basis.
Where To Find Shop Data
Seller Center And Shop Tab
Your first stop is the Shop Tab & Search Analytics page in Seller Center. TikTok's Seller University lists the path: open Analytics, then select Shop Tab & search from the header. The page shows GMV, impressions, orders, items sold, and conversion rate. GMV counts the total amount paid for Shop Tab orders, including returns and refunds. Items Sold counts individual units, so a customer who buys 3 units of SKU A and 2 units of SKU B adds 5 to the total. You can export the key metric data as an XLS file for deeper analysis.
Sign in to Seller Center.
Open the Analytics menu.
Select Shop Tab & search from the header.
Review GMV, impressions, orders, items sold, and conversion rate.
Export the key metrics to XLS when you need a custom view.
Seller Center dashboards also break down traffic sources and top products. The Traffic section shows impression share, click-through rate, and click-to-order rate, which equals SKU orders divided by clicks. Product views add add-to-cart rate, real-time stock, and status alerts for items at risk of running out within the next 7 days. You can filter for out-of-stock products and jump straight to replenishment or ad creation.
Affiliate Center And Search Analytics
Affiliate Center holds the creator side of your tiktok shop analytics. Open Affiliate Center, then Analytics, then Performance to monitor GMV, orders, videos, LIVEs, and creators. You can drill into creator and product detail pages, compare trends, and export the data. A same-day Today view gives you live snapshots, though TikTok notes these may differ slightly from finalized next-day figures, so refresh manually when you need current numbers.
Pair that view with creator health metrics. Track active creator count, GMV per creator, and content velocity alongside your affiliate GMV. Default attribution runs on a 7-day click and 7-day view window, with the most recent interaction earning credit and clicks taking precedence over views.
Revenue Metrics To Track
GMV And Average Order Value
GMV is your starting revenue number. HiveHQ gives two ways to calculate it: GMV = Units Sold × Average Sale Price, or GMV = Number of Transactions × Average Order Value. If you sell 200 pairs of shoes at $50 each, your GMV is $10,000.
Formula Type | Formula |
|---|---|
Simple formula | GMV = Units Sold × Average Sale Price |
Operator formula | GMV = Number of Transactions × Average Order Value |
Average order value tells you whether bundles, upsells, pricing, and product mix lift each cart. Order count can stay flat while bundles raise cart size, and GMV still rises. A stronger merchandising setup can even produce fewer orders with better basket sizes. Both paths lift GMV, but they create different margin outcomes, inventory pressure, and commission costs. RedStag Fulfillment reports that beauty and apparel categories on TikTok Shop deliver average order values of $63-64, above the platform average, driven by bundling. Instead of selling a single $12 claw clip, you can offer five colors for $35. That adds perceived value and raises order size. Review AOV weekly alongside GMV so you catch a falling basket size early.
Refunds And Net Revenue
Refunds shrink the revenue you keep. Kixmon explains that every return triggers a 20% refund admin fee on the original referral charge, capped at $5 per SKU in the US. A $30 product with a $1.80 referral fee costs you $0.36 per return, even when the customer gets a full refund. At a 10% return rate across 100 orders, that is $3.60 in hidden costs, plus losses on inventory you cannot resell. Kixmon notes that restocking fees can claim 10-20% of returned product value when items are not resellable.
Net Profit = Sale Price – (COGS + Shipping + Referral Fee + Transaction Fee + Affiliate Commission + Return Buffer + Ad Spend)
Kixmon recommends modeling this formula across 100 orders and factoring in a refund rate of 8-12%. Track net revenue, not gross sales, to see what your shop truly earns. A high refund rate quietly erodes every gain you make on the front end.
Customer And Content Metrics
Conversion Rate And Traffic Sources
Conversion rate tells you how well each traffic source turns viewers into buyers. Emplicit reports benchmark conversion rates by source, and the gaps are wide.
Traffic Source | Benchmark Conversion Rate |
|---|---|
LIVE Shopping | 8-12% |
Short-form Videos | 2-4% |
Shop Tab | 1.5-3% |
Emplicit also charts these benchmarks, with LIVE Shopping at a 10 percent midpoint, short-form videos at 3 percent, and the Shop Tab at 2.25 percent.
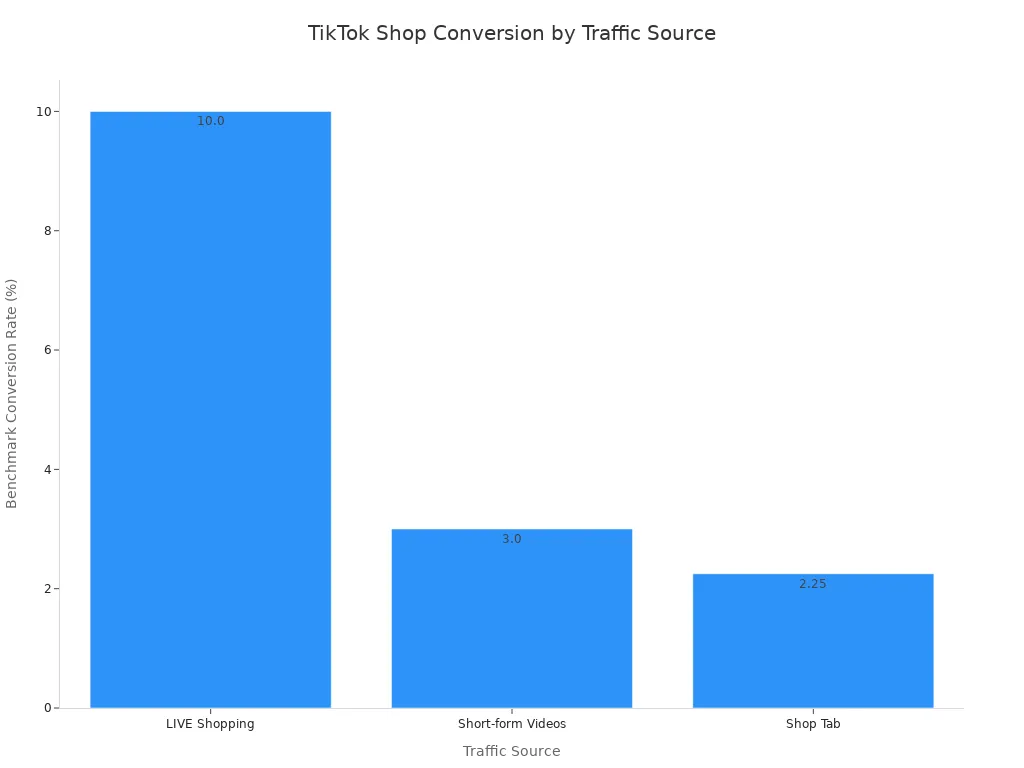
Use these ranges to judge each channel against its own baseline. A 3 percent video conversion rate looks weak next to LIVE, yet it sits at the top of the video range. Emplicit suggests a click-through rate of at least 2 percent and a view-through rate of 30 percent or higher to evaluate content effectiveness. Seller Center's Data Compass refines the picture by splitting revenue across Ads, Affiliate, and Non-Ads sources. Stord notes that every step you remove from the purchase path can lift conversion, so keep checkout inside the app.
Creator And Affiliate ROI
Affiliate performance deserves its own scorecard. Hamster Garage reports that affiliates drive 42 percent of TikTok Shop's US GMV, so creator ROI is not a side metric. Track affiliate-attributed revenue, orders, average order value, conversion rate, and revenue per creator, as Livano Agency recommends. Creator-level data shows where sales actually come from.
Compare your returns against Hamster Garage's benchmarks. Top-performing brands earn 3.8x to 5.2x ROI on every dollar of commission. Median sellers earn 2.1x to 2.9x. Hamster Garage attributes the gap to operations: strategic recruitment, creator assets, and continuous tracking. Set commissions around product economics, not a universal rate. Hamster Garage puts the average US influencer commission at 13.02 percent, with affiliate video conversion at 3 to 6 percent and LIVE sessions at 5 to 12 percent. Move your top creators into targeted deals once they prove repeat volume.
Operations And Profit Metrics
Fulfillment And Cancellation Rates
Fulfillment speed and cancellation rates show whether your back end keeps the promises your content makes. A viral video can send hundreds of orders in a day. If your warehouse cannot ship them on time, buyers cancel, and those cancellations erase the GMV you just earned. Watch your cancellation rate next to your order volume. A rising rate during a spike points to a stock or staffing problem, not a demand problem.
Track late shipments and out-of-stock alerts in the same weekly review. Seller Center flags products at risk of running out within the next 7 days, so act on those alerts before they turn into cancellations. High cancellation rates also hurt your Shop Performance Score, which feeds back into how the platform ranks your listings. Treat fulfillment as a revenue metric, not a logistics afterthought.
Contribution Margin And Profit Tools
Contribution margin is the revenue left after you subtract every variable cost tied to a sale. Socialtale lists those costs plainly:
COGS plus shipping
TikTok Shop's platform fee, typically 6-8%
Affiliate commission, typically 15-25%
Amortized sample costs and return impact
Socialtale puts a healthy contribution margin for TikTok Shop at 15-30% after all variable costs. Run this math per product, not per shop. One hero SKU can carry a healthy margin while a bundle quietly loses money on commissions and returns.
A net profit calculator makes the weekly check fast. HiveHQ recommends subtracting costs in a set order: COGS first, then platform and transaction fees, then creator commissions, then fulfillment, shipping, and ad spend. That sequence shows you where margin leaks. HiveHQ's core formula is gross revenue minus total costs equals net profit. Review contribution margin beside GMV each week. A GMV record means little when margin falls below the healthy range.
Using TikTok Shop Analytics To Find What Works

Raw totals hide the story. Your tiktok shop analytics only pay off when you split the numbers apart and compare like with like. Two habits do most of the work: separating sales by source, then reading the funnel stage by stage.
Separate Sales By Source
Start by tagging every sale to its origin. TikTok Shop records purchases from your storefront, short videos, the in-app shop, LIVE sessions, and affiliate-driven content. Pull each source into its own row before you judge performance. A flat GMV month can hide a LIVE channel that doubled while affiliate sales slipped. Source-level data shows you where to spend effort next.
Split affiliate sales from your own content too. A creator video and a brand video may sell the same product at very different conversion rates. Compare each source against its own benchmark, not against the shop average. That comparison tells you whether to recruit more creators, produce more brand content, or fix a weak channel.
Read The Conversion Funnel
Winning Hunter lays out the full path a buyer travels:
Product or content impression
Product click
Product page visit
Add to cart
Checkout
Paid order
Delivered order
Retained sale
Calculate the conversion rate between each stage. Then find the sharpest decline. That point deserves your attention before you buy more traffic. Traffic without conversion just burns budget.
The fix depends on where the drop sits. High impressions with few clicks point to audience fit, opening creative, product positioning, price visibility, or offer clarity. Strong clicks with few paid orders point to the listing, total price, shipping cost, delivery estimate, reviews, stock, or product variations. Healthy order volume with weak retained revenue points to cancellations, failed deliveries, returns, refunds, quality complaints, or fulfillment errors. Do not stop at paid orders. A sale only counts as lasting revenue once it reaches the customer and survives the return period.
LIVE sessions carry their own funnel. Christiffer Berry tracks live impressions, enter room rate, product impressions, click-through rate, orders placed, and click-through order rate. An enter room rate below 3-4% signals weak set design, host energy, or visuals. Low click-through rates suggest the product offer does not interest your audience. Low click-through order rates point to pricing or product information problems, such as missing popular colors or sizes.
Order counts also need context. One customer order can hold several products, variations, or units. A shopper who buys three units of one variation and two of another creates one customer order, two SKU orders, and five items sold. Divide units sold by orders to see items per transaction.
Build a simple scorecard for each product and creator. List GMV, orders, conversion rate, and contribution margin side by side. Contribution margin = revenue minus all variable costs, including COGS, platform fees, commissions, and returns. A creator with high GMV but thin margin may cost you money on every sale. Review the scorecard weekly and retire combinations that stay weak. Kixmon offers third-party profit tracking for accurate margin figures when manual math gets heavy.
Mistakes And Weekly Review Cadence
Mistakes That Distort Data
Several common errors quietly corrupt your tiktok shop analytics. HiveHQ flags the biggest ones. Sellers celebrate top-line GMV while ignoring true profit, so a shop reporting $100,000 in monthly GMV may actually run at a loss. Untracked affiliate spending is another trap. A seller might pay a flat 15% commission to 50 creators and never notice that just five of them drive 80% of sales. Weak creator monitoring turns an affiliate program into a money pit when 40 of 50 paid creators produce no sales in a month.
Tracking setup adds its own distortions. Trackingplan warns that a misconfigured pixel, broken UTM parameters, or missing add-to-cart events all skew attribution. Echotik notes that third-party tools see gross revenue only. They cannot see refunds, coupon funding, or ad spend, so two shops with identical estimated revenue can be very different businesses. TikTok also defaults to last-click attribution, which undervalues creators who build awareness. Shortformnation suggests weighting credit instead: 50% to the last-click creator, 30% split across creators with the most saves and shares, and 20% to the first-touch creator.
Building A Weekly Routine
A fixed cadence keeps these errors from compounding. Eseospace recommends a weekly review meeting with four parts: check the shop health dashboard, review sales and traffic KPIs such as GMV, AOV, and conversion rate, review affiliate performance to spot rising stars, and set one optimization priority for the coming week.
Separate tactical reviews from strategic ones. Dashboardly suggests weekly reports cover ad spend pacing, top-performing videos, and inventory alerts, while monthly reports handle a full P&L review, net profit by product, creator ROI, and return rate trends. Add a halo check to the monthly pass. Shortformnation estimates the halo effect drives 30-50% of incremental revenue outside TikTok Shop, and non-TikTok revenue often rises 2-5 days after content peaks. Chart both lines together to see it.
Four numbers carry the most weight in your shop: GMV, conversion rate, creator ROI, and contribution margin. GMV shows demand. Conversion rate shows how well each channel turns viewers into buyers. Creator ROI shows which affiliates earn their commission. Contribution margin shows what you actually keep after fees, returns, and ad spend.
You do not need to fix everything this week. Pick one metric, such as contribution margin. Record your baseline today, then review it on a fixed schedule. Small, steady gains compound fast. A margin that climbs from below the healthy 15–30% range into it changes your whole business. Chase one number at a time, and the rest will follow.
FAQ
How often should you review TikTok Shop analytics?
Run a weekly review of GMV, conversion rate, and affiliate performance. Add a monthly pass for full profit and loss, net profit by product, creator ROI, and return rate trends. A fixed cadence beats a daily scramble, because small errors compound fast when nobody checks them.
Which metric should a new seller track first?
Start with conversion rate. It shows whether each traffic source turns viewers into buyers. Compare LIVE, short video, and Shop Tab results against their own benchmarks. Once conversion looks healthy, move your attention to contribution margin and creator ROI.
Why do Seller Center and Ads Manager show different numbers?
The two systems use different attribution settings and date ranges. Seller Center tracks shop sales across storefront, video, LIVE, and affiliate sources. Ads Manager tracks paid campaign events. Match every report to its attribution window and date basis before you compare them.
How do you know whether a creator earns their commission?
Build a scorecard with GMV, orders, conversion rate, and contribution margin for each creator. High GMV with thin margin can lose money on every sale. Retire weak combinations weekly and move proven creators into targeted deals.
What counts as a healthy contribution margin?
Aim for 15–30% after all variable costs. Subtract COGS, shipping, platform fees, affiliate commission, sample costs, and return impact. Check the math per product, not per shop. One hero SKU can carry a healthy margin while a bundle quietly loses money.
See Also
In-Depth Data Analysis to Boost TikTok Shop Performance
Essential TikTok Analytics Tool for Effective Performance Tracking
Complete Guide to Mastering TikTok Analytics for Better Results